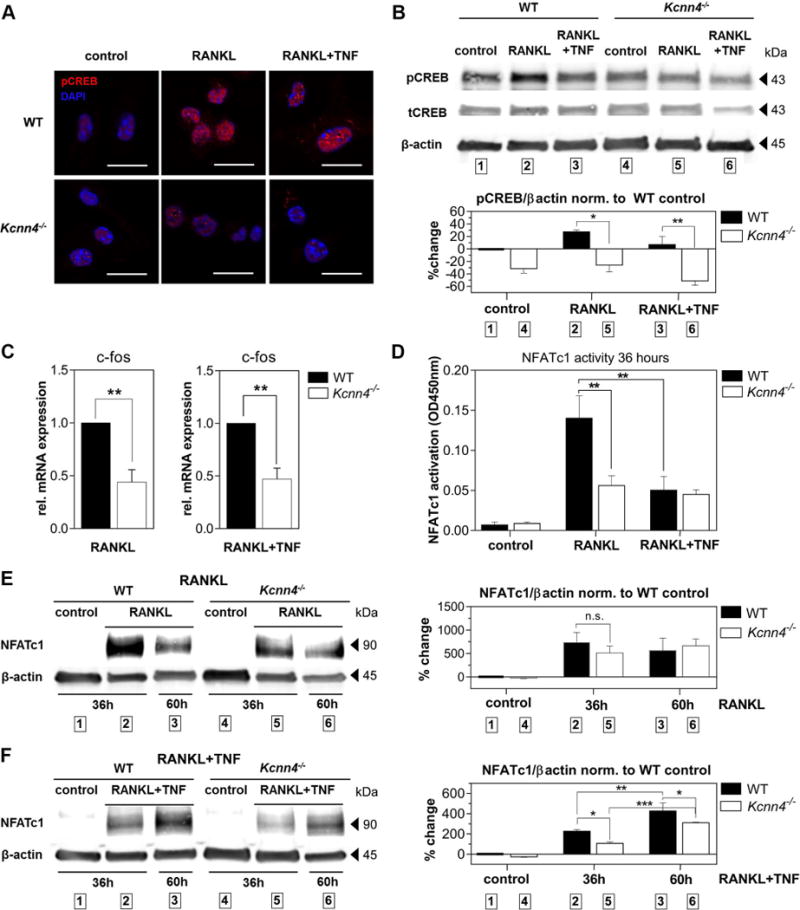
Figure 4. Kcnn4−/− BMMs show decreased phosphorylation of CREB and expression of c-fos followed by reduced amplification and activity of NFATc1.

A) IF staining of phosphorylated CREB (pCREB, red) and DAPI (blue) of BMMs obtained from WT and Kcnn4−/− mice stimulated with RANKL or RANKL+TNF for 36 hours visualized with confocal microscopy (N=2, scale bar = 15 µm); B) Western blot analysis of pCREB versus total CREB (tCREB) and β-actin; top: representative blot; bottom: densitometric analysis; one-way ANOVA with post-hoc multiple comparison test was performed (N=2, P=0.004); C) qPCR analysis showing normalized c-fos mRNA expression of WT control and Kcnn4−/− BMMs cultivated in indicated conditions for 36 hours; Student’s unpaired t-test was performed (N=4); D) Transcription factor binding assays showing transcriptionally active NFATc1 protein obtained from nuclear lysates of 36-hours-stimulated WT and Kcnn4−/− BMMs in indicated conditions; one-way ANOVA with post-hoc multiple comparison test was performed (N=3, P=0.0003); E, F) Western blot analysis of NFATc1 protein expression obtained from whole cell lysates of WT and Kcnn4−/− BMMs stimulated for given time periods in indicated conditions; left: representative blots, right: densitometry analysis; one-way ANOVA with post-hoc multiple comparison test was performed (E) N=3, P=0.0164; F) N=3, P<0.0001); shown are means ± SEM, *P<0.05, **P<0.01, ***P<0.001.
