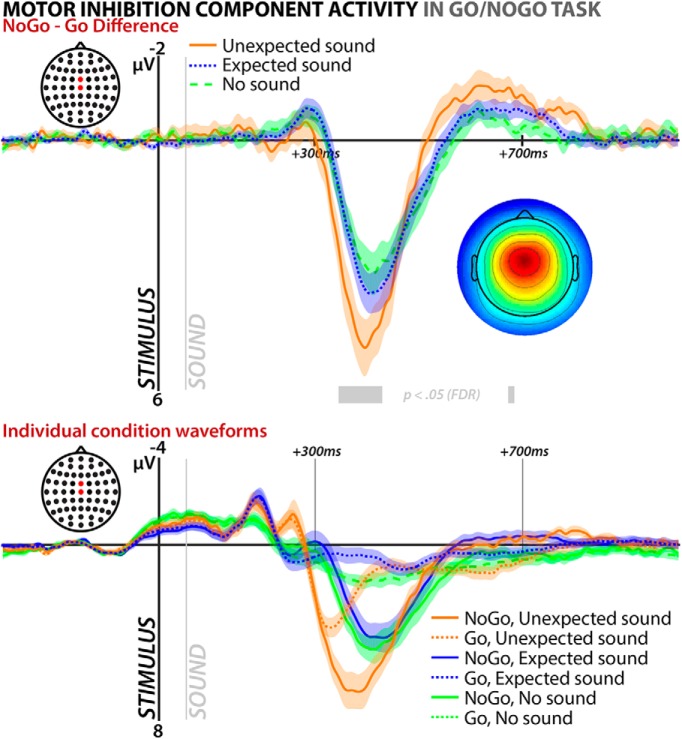
Figure 5.
EEG results from Experiment 2; ERP of the motor inhibition independent component selected from the stop signal portion of the data on the surprise–Go/NoGo task portion of the data. Both graphs show average back-projected ERP at electrodes FCz and Cz time-locked to stimulus onset in the surprise–Go/NoGo task. Top plot shows difference waves between NoGo and Go trials for all three sound conditions (unexpected, expected, no sound). Stretches of data with a significant main effect of sound condition at p < 0.05 (FDR corrected) are highlighted in gray. Bottom plot shows individual condition waveforms.

