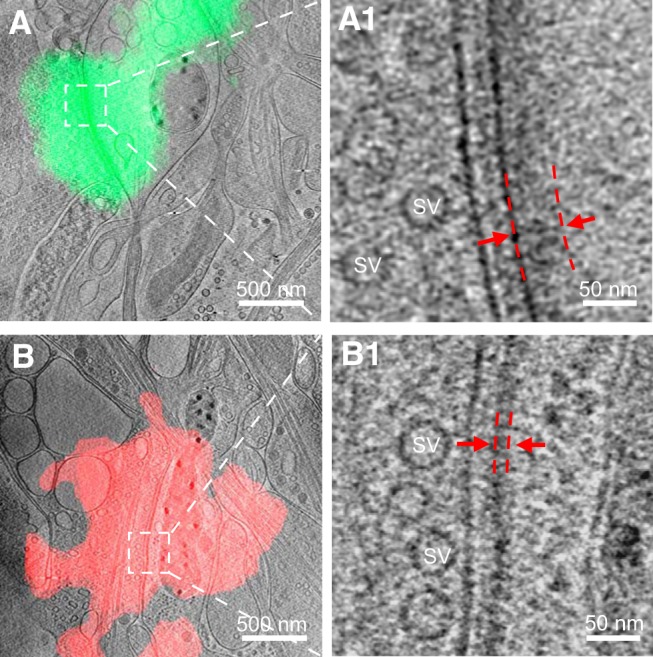
Figure 3.

Identification of excitatory and inhibitory synapses with cryo-CLEM. A, B, Tomographic slices of an excitatory (A) and inhibitory (B) synapse colocalized with PSD-95-EGFP and mCherry-gephyrin puncta, respectively. A1, B1, Zoomed-in views of the boxed area in A and B showing the synapse with thick and thin PSD, respectively. Red dashed lines indicate the range of the PSD.
