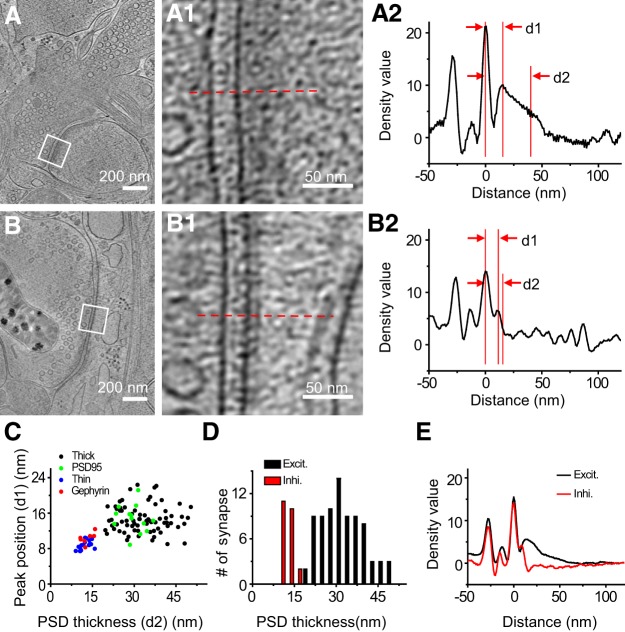
Figure 4.
Quantitative and statistical characterization of excitatory and inhibitory PSDs. A, B, Tomographic slices of two synapses with thick and thin PSD respectively. A1, B1, Zoomed-in views of the marked areas in A and B. A2, B2, Normalized density profiles of the two synapses in A and B respectively with cross-sectional mean density plotted against distance to postsynaptic membrane (see Materials and Methods). On the x-axis of this plot, 0 was set to be the position of the postsynaptic membrane, and positive values are on the postsynaptic side. The density profiles were normalized against the density values at distances ranging from 100 to 200 nm such that the average density value in this range is zero and their SD is unity. d1, PSD peak position; d2 is the sum of d1 and the length constant obtained from the exponential fit of the profile from d1 to the flattened background, to provide a measure of the thickness of the PSD (see Materials and Methods). C, Scatter plot of PSD peak position and PSD thickness of all synapses show two well defined clusters. D, Histogram shows the PSD thickness distribution of all excitatory and inhibitory synapses respectively. E, Averaged density curve of all excitatory synapses and all inhibitory synapses respectively.

