Figure 6.
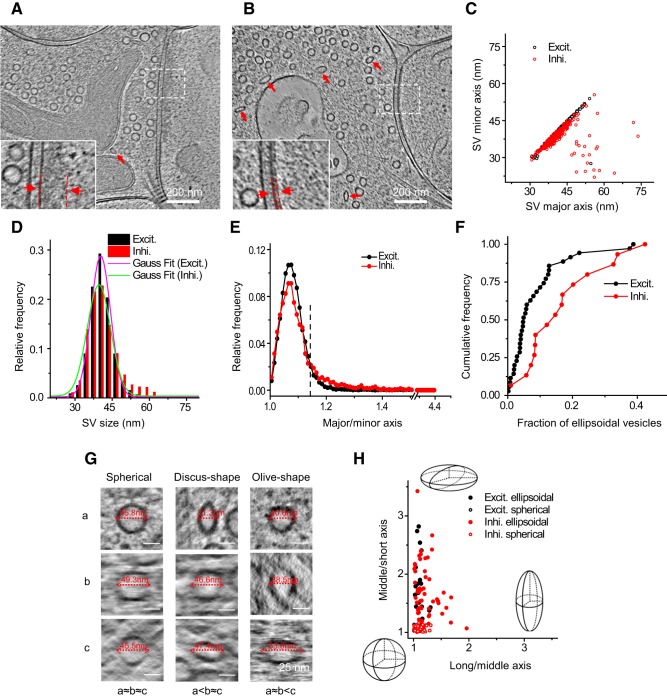
Heterogeneity of synaptic vesicles in excitatory and inhibitory synapses. A, B, Tomographic slices of an excitatory and an inhibitory synapse respectively. Insets are zoomed-in views showing thick and thin PSDs from A and B respectively. C, Scatter plot showing the major and minor axes of SVs in the two synapses in A and B measured by 2D fitting. D, Distribution of vesicle sizes in excitatory and inhibitory synapses (16,476 vesicles in 35 excitatory synapses and 4766 vesicles in 15 inhibitory synapses). E, Distribution of ellipticity of SVs (major to minor axis ratio) in excitatory and inhibitory synapses. A threshold (dashed line) was set at major/minor = 1.14, which is approximately twice the peak position (major/minor = 1.07) from perfect circle (major/minor = 1) to separate ellipsoidal from spherical vesicles. Coincidentally, this threshold is also close to the cross point of the two distribution curves. F, Cumulative frequency of the fraction of ellipsoidal vesicles in excitatory and inhibitory synapses. G, Tomographic slices of spherical (left column), discus-shaped (i.e., oblate spheroid, middle column), and olive-shaped (i.e., prolate spheroid, right column) SVs viewed in three orthogonal planes rotated so that each of the three principle axes (a–c) of the vesicles can be measured horizontally in the corresponding plane. For the spherical vesicles, a≈b≈c; for discus-shaped ones, a<b≈c; for olive-shaped ones, a≈b<c. H, Long to middle axis ratio versus middle to short axis ratio of 70 ellipsoidal SVs and 70 adjacent spherical SVs in five excitatory and five inhibitory synapses. Schemes depict the shapes at the given positions in the plot.

