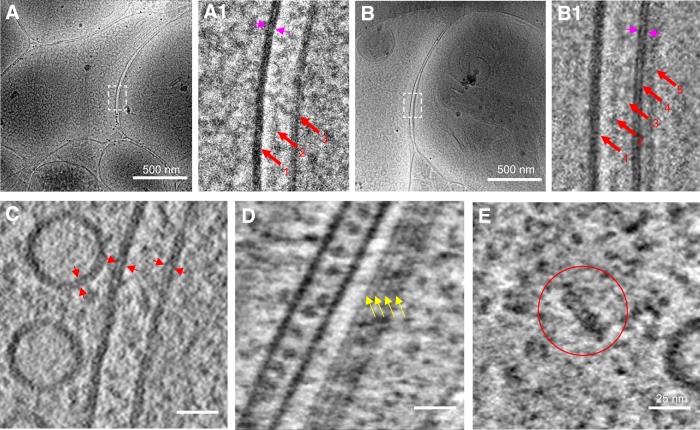
Figure 7.
High-resolution cryo-ET of synapses obtained using VPP, electron energy filter, and direct electron detection. A, B, Single-projection cryo-EM images of an excitatory and inhibitory synapse respectively. A1, Zoomed-in view of the white boxed area in A showing three bands of increased density (red arrows) at the junctional area: presynaptic membrane, intercleft band, and postsynaptic membrane. The two leaflets of membrane bilayer can be distinguished (paired magenta arrows). B1, Zoomed-in view of the white boxed area in B showing five density bands (red arrows) at the junction: presynaptic membrane, two intercleft bands, postsynaptic membrane, and postsynaptic density. Two leaflets of membrane bilayer can also be distinguished (paired magenta arrows). C, Two leaflets of membrane bilayer (paired arrowheads) at SVs and synaptic membrane were evident in the reconstructed tomographic slice. D, E, Tomographic slices showing macromolecular structures, such as microtubule protofilaments (D, yellow arrows) and proteasome-like particle (E, red circle) in different synapses.

