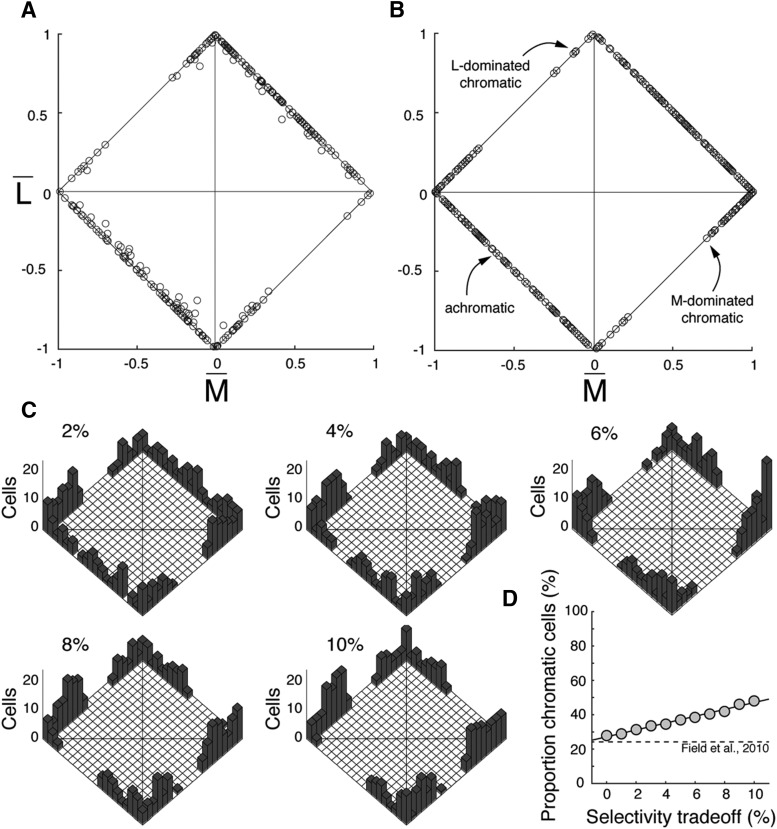
Figure 12.
Comparison of model and empirical cells in the retinal periphery. Opponency in individual model cells was quantified by calculating the relative strengths of the total input from L and M cones across the entire receptive field, and the normalized weights [x axis, (MC − MS)/(LT + MT); y axis, (LC − LS)/(LT + MT)] were plotted as in Field et al. (2010; their Fig. 4H). Cells that plot in the first and third quadrants do not show cone-opponent responses, whereas cells located in the second and fourth quadrants do show cone-opponent responses. A, Chromatic and achromatic cells identified in a single recording at 6.75 mm temporal eccentricity, modified from Field et al. (2010, their Fig. 4H). A third axis quantifying the orthogonal departure of some cells from the L and M axes (illustrating putative S-cone input) has been removed for clarity. Sixty-three of 263 total midget cells (24%) showed L–M opponent responses, characterized by their location in the second and fourth quadrants. Notably, the opponent responses of these cells is weak, illustrated by an absence of cells at the midpoints of the diagonals (where L and M weights are equal and opposite) and a clustering of cells toward the x and y axis endpoints, where an overall L- or M-cone bias to the receptive field is demonstrated. B, In a population of model cells generated on the range of 6–8 mm eccentricity, 87 of 312 total cells (28%) were opponent, similarly demonstrating both an absence of strongly opponent cells at the midpoints of the diagonals and clusters of weakly opponent cells toward the x and y axis endpoints. C, D, To test the effects of synaptic strengthening as a mechanism for selectivity, the model population was subject to “tradeoff,” in which amplitude for the dominant cone type in the receptive field center was enhanced at the expense of the nondominant cone type. Tradeoff is represented as a percentage of the total response amplitude. C, As synaptic tradeoff increased, the number of chromatic cells in the population increased, indicated by the migration of cells from the first and third quadrants (achromatic) to the second and fourth quadrants (chromatic). Populations after adding 2%, 4%, 6%, 8%, and 10% selectivity are shown (histograms). Axes are the same as A and B. D, The effect of mild selectivity quickly produced model populations with higher proportions of chromatic cells that reported in the original model (0% selectivity tradeoff) or in Field et al. (2010, dashed line).

