Figure 5.
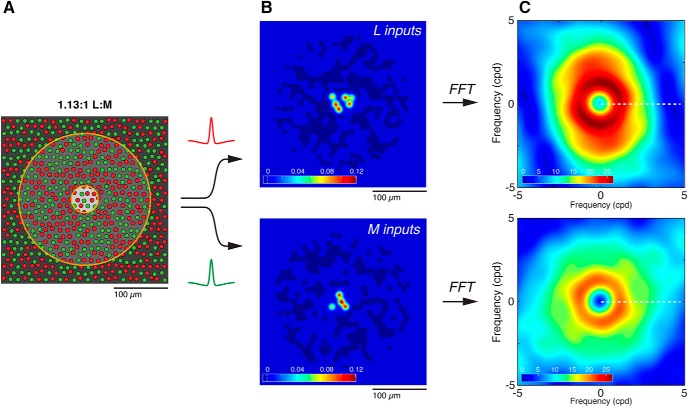
Generating model receptive fields. A, A simulated patch of cone mosaic for a model cell at 5 mm eccentricity. The mosaic was generated on a triangular grid with random jitter; L and M cones were then randomly assigned. Overall L:M cone ratio for the patch was drawn from a distribution of ratios observed empirically, and cone density and diameter were assigned as a function of eccentricity. Receptive field size was also assigned as a function of eccentricity; this model cell's receptive field center (light gray circle) and surround (dark gray circle) are shown. B, To evaluate isolated L- and M-cone sensitivity, receptive field profiles for L and M inputs were separated and a difference-of-Gaussians kernel applied to weight the contribution of every cone in the receptive field. Heat maps illustrate the normalized strength of weighted L (top) and M (bottom) inputs to the cell's receptive field. Very strong inputs from 10 cones contribute to the receptive field center (red, yellow), whereas ∼350 cones comprise a much weaker input of the opposite sign to form the surround (dark blue). Color bars represent the normalized contribution of each cone ranges from approximately −0.05 (surround cones) to 0.12 (center cones). C, Fourier transforms of the spatial maps were used to evaluate the frequency tuning of L and M inputs to the cell. Response amplitude (top, L inputs; bottom, M inputs) and phase (data not shown) were determined from the real and imaginary components of the complex transform, respectively. Values were evaluated along a single axis, representing a continuous range of spatial frequencies (dotted line).

