Figure 7.
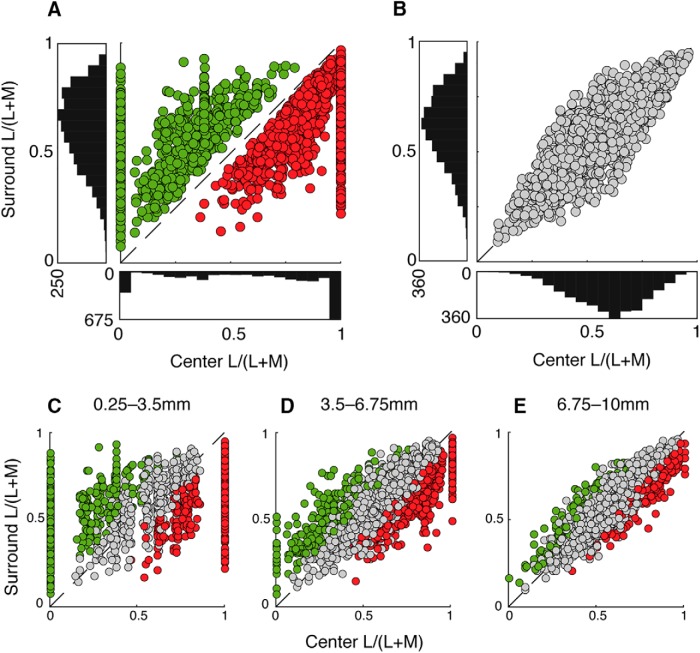
L- versus M-cone disparity between receptive field center and surround determines cone opponency. Chromatic opponency is afforded to model cells with a sufficient cone disparity between center and surround. A, For chromatic model cells demonstrating cone opponency, plotting the cone purity index of center (x axis) versus surround (y axis) shows that all cells with L-dominated centers (red) fall below the diagonal, where M dominates to the surround. Conversely, cells with M-dominated centers (green) fall above the diagonal, where L dominates to the surround. Cone purity index values to center were highly variable and skewed toward 1 (pure L) or 0 (pure M). B, For achromatic model cells, plotting each cell's cone purity index to center (x axis) and surround (y axis) shows balanced L- and M-cone inputs between center and surround, indicated by points clustered along the diagonal. C–E, Binning model cells by eccentricity reveals more chromatic cells (with unequal cone purity index values) at near retinal locations (C), gradually supplanted by weakly chromatic and achromatic cells (more balanced cone purity index values) at intermediate (D) and far (E) eccentricities.

