Figure 7.
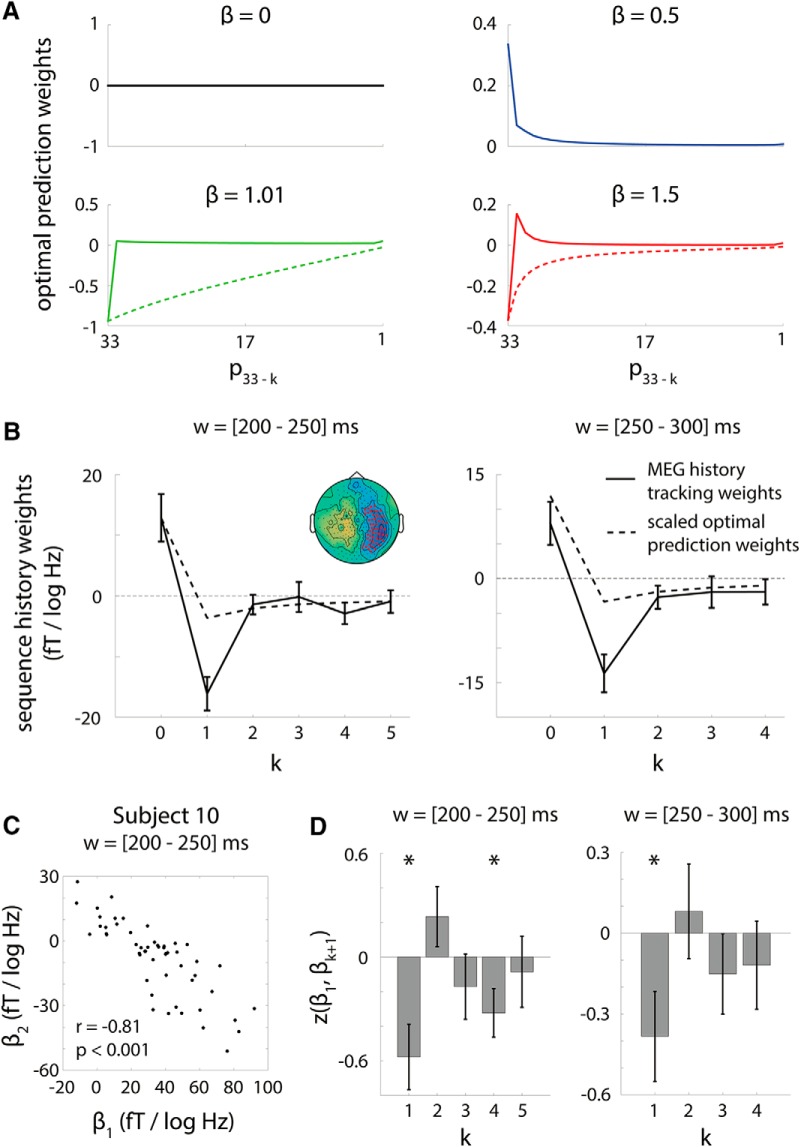
Relationship between history integration weights and optimal prediction weights. A, Optimal prediction weights as a function of sequence β. For 1/fβ-type sequences, the expected value of the upcoming item is a weighted sum of the previous items; these weights (“optimal prediction weights”) are plotted as solid lines for each β level. For β < 1, expected value depends on the ak+1 weights (Eq. 1). For β > 1, expected value depends on the weights [a1, (a2 − a1), …, (ak + 1 − ak), −ak + 1] (Eq. 2). For β > 1 sequences, dashed lines show optimal prediction weights for the corresponding fGn sequence with scaling parameter β-2, which were used to derive the weights in Equation 2 and shown in solid lines. B, History integration weights resemble scaled optimal prediction weights. In the time window of 200–300 ms, the dependence of MEG activity on pitch history (solid lines) in the significant prediction cluster (inset left column, red sensors; reproduced from Fig. 5B, 200–250 ms window) reflected the pattern exhibited by the scaled optimal prediction weights averaged across sequence β (dashed lines). This resemblance accounts for why history-dependent MEG activity carries the prediction effect (Fig. 6; Eqs. 7 and 8). C, Correlation between history integration weights on current and previous pitches. To further explore the apparent opposing effects of the current and previous pitch on MEG activity illustrated in B, we computed across-sensor correlations in the prediction cluster between the weight on the current pitch, β1, and weights on previous pitches, βk + 1, k ≥ 1. Here, we show an example scatterplot of the across-sensor relationship between β1 and β2 for one subject. D, Inverse correlation between current and previous pitch weight. Across subjects, the influence of the current and previous tone pitch on MEG activity was significantly inversely correlated for the 200–250 ms (t(10) = −3.0, p = 0.01) and 250–300 ms (t(10) = −2.3, p = 0.04) time windows, as assessed by a one-sample t test on the Fisher's z-transform of the correlation coefficients. Asterisks denote p < 0.05. Error bars denote SEM across subjects.

