Figure 5.
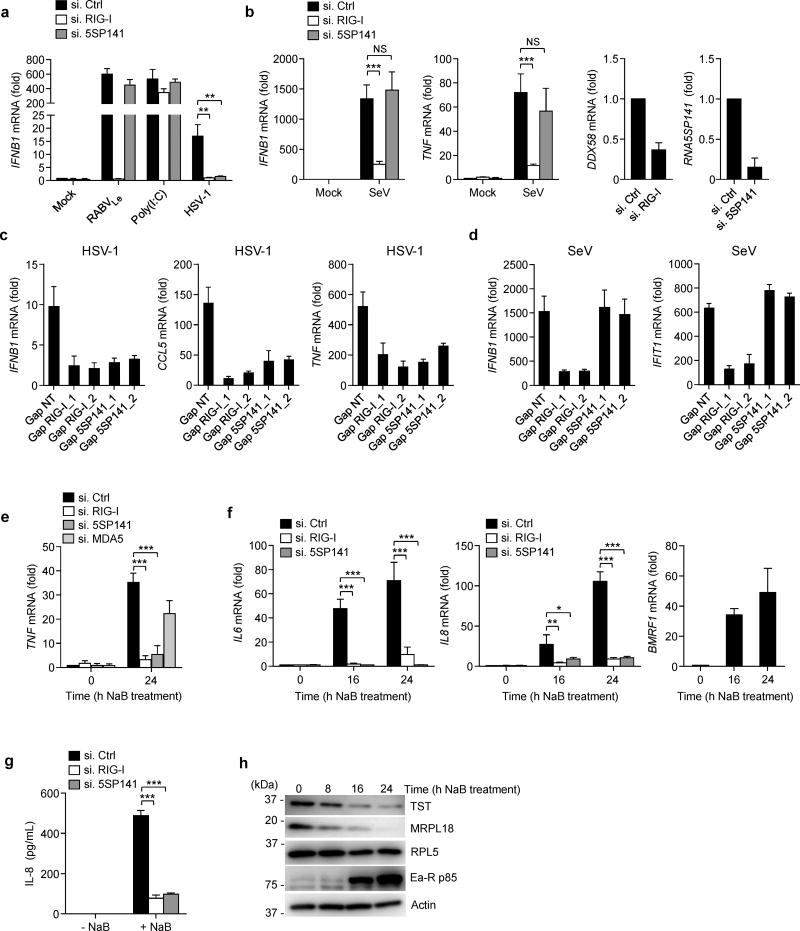
RNA5SP141 mediates cytokine responses to HSV-1 and EBV. (a) qRT-PCR analysis of IFNB1 mRNA in NHLF cells transfected with either non-targeting control siRNA (si.Ctrl), or siRNAs targeting RIG-I (si.RIG-I) or RNA5SP141 (si.5SP141) for 72 h and then infected with HSV-1 (MOI 0.1) for 16 h, or left uninfected (Mock). Cells transfected with 1 pmol in vitro–transcribed RABVLe or 0.05 µg/mL HMW-poly(I:C) for 16 h served as controls. (b) Left, middle left: qRT-PCR analysis of IFNB1 and TNF mRNA in HEK 293T cells transfected with the indicated siRNAs as in (a) followed by infection with SeV (50 HAU/ml) for 16 h. Middle right, right: Knockdown efficiency of endogenous RIG-I (DDX58) and RNA5SP141 was confirmed by qRT-PCR analysis. (c) qRT-PCR analysis of IFNB1, CCL5, and TNF mRNA in NHLF cells transfected with either non-targeting control gapmer (Gap NT), or two different gapmers targeting RIG-I (Gap RIG-I_1 and Gap RIG-I_2) or RNA5SP141 (Gap 5SP141_1 and Gap 5SP141_2) for 72 h and then infected with HSV-1 (MOI 0.1) for 16 h. (d) qRT-PCR analysis of IFNB1 and IFIT1 mRNA in NHLF cells transfected as in (c) and then infected with SeV (25 HAU/mL) for 16 h. (e) qRT-PCR analysis of TNF mRNA in AGS-EBV cells transfected with the indicated siRNAs for 72 h, followed by treatment with 2.5 mM sodium butyrate (NaB) for 24 h to induce EBV reactivation. (f) Left, middle: qRT-PCR analysis of IL6 and IL8 mRNA in AGS-EBV cells transfected with the indicated siRNAs for 72 h, followed by treatment with 2.5 mM NaB for the indicated times to induce EBV reactivation. Right: EBV reactivation was confirmed by qRT-PCR analysis of EBV early gene BMRF1 mRNA. (g) ELISA of IL-8 in the supernatants of AGS-EBV cells that were transfected with the indicated siRNAs for 72 h, followed by treatment with 2.5 mM NaB for 24 h to induce EBV reactivation. (h) Abundance of endogenous TST, MRPL18, and RPL5 proteins in the WCLs of AGS-EBV cells treated with 2.5 mM NaB for the indicated times, determined by IB. IB analysis of EBV early antigen-restricted p85 (Ea-R p85) and cellular actin served as infection and loading controls, respectively. Data are representative of two (a, b, f, g, h) or three (c, d, e) independent experiments (mean and s.d. of n = 3 biological replicates in a, b, c, d, and f, n = 2 biological replicates in e and g). *P < 0.05, **P < 0.01, ***P < 0.001 (unpaired t-test). NS, statistically not significant.

