
Figure 6.
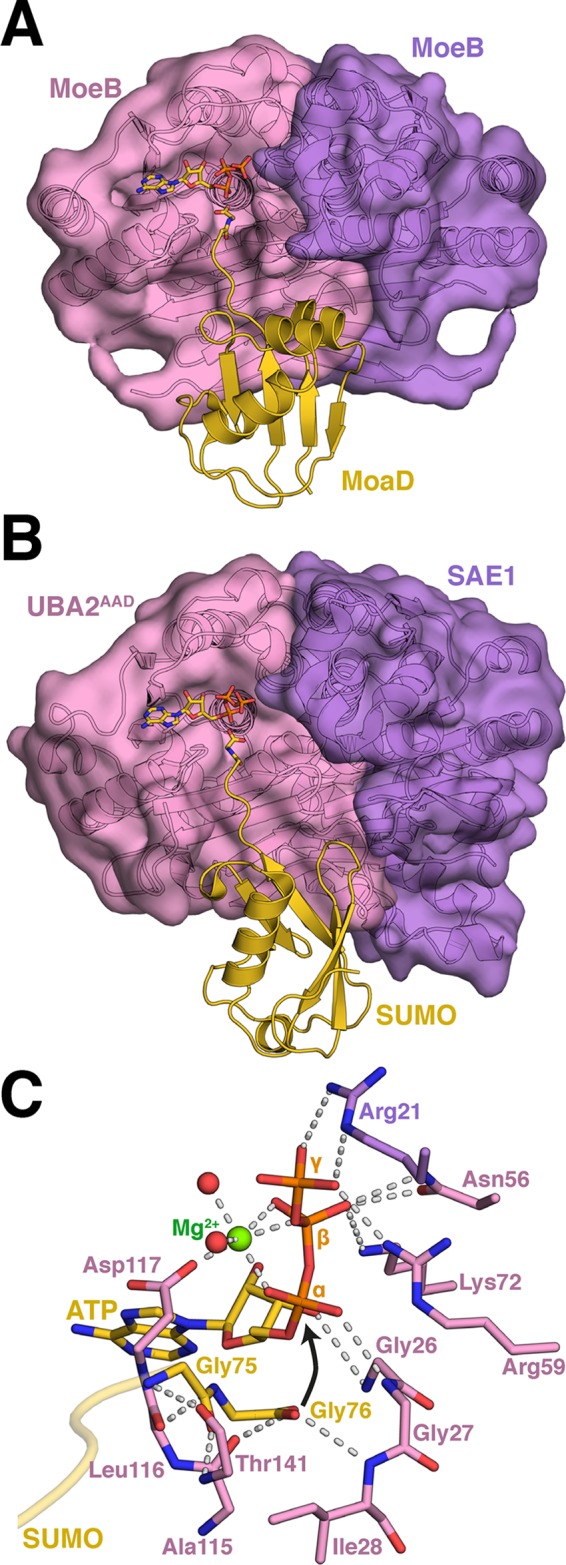
Adenylation domains of E1 and E1-like proteins. (A) Structure of E. coli MoaD/MoeB/ATP (PDB 1JWA). (B) Structure of human E1SAE1/UBA2/SUMO/ATP (PDB 1Y8R). In both cases, Ubl and adenylation domains are depicted in cartoon and Gaussian surface representations. The ATP and last two residues of the Ubl’s are in stick representation. (C) Close-up view of interactions between ATP, the SUMO C-terminus, and the E1 adenylation pocket.