
Figure 9.
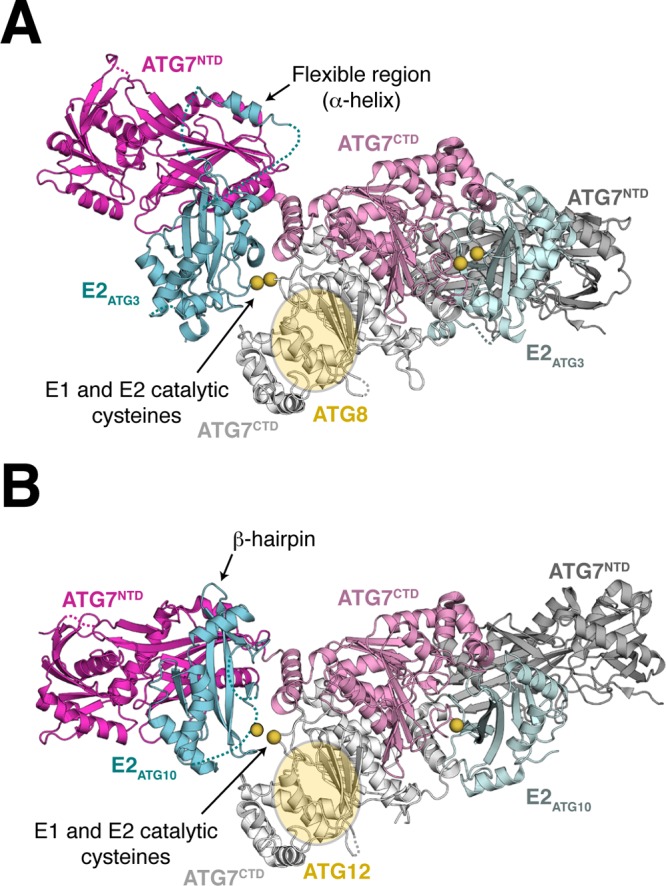
E1–E2 interaction for ATG7. (A) Structure of S. cerevisiae E1ATG7–E2ATG3 (PDB 4GSL). (B) Structure of S. cerevisiae E1ATG7–E2ATG10 (PDB 4GSK). In both cases, E2 binding occurs between the NTD and CTD domains of E1ATG7. Dashed lines represent regions missing elements in the crystal structure. Sulfur atoms of the catalytic cysteine residues of E1ATG7 and E2ATG3 are in sphere representation colored yellow. The catalytic cysteine of E2ATG10 is not visible in the structure. The position of ATG8 or ATG12 on the adenylation domain is indicated by a yellow oval.