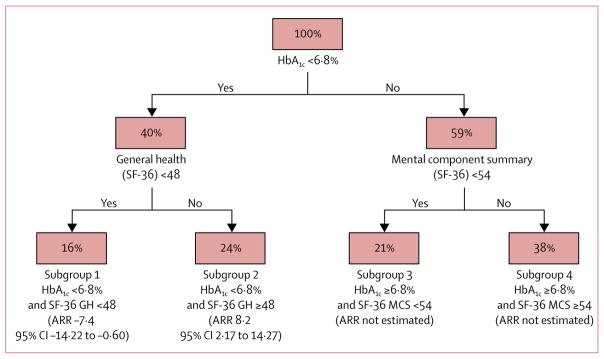
Figure 2. Subgroups identified by the representative causal tree.
Nodes indicate the percent of the training data sample in each subdivision of the data, with the covariate and split point identified underneath. For example, subgroup 1 contains 16% of the training data and includes participants with baseline HbA1C less than 6·8% and baseline SF-36 general health score less than 48, and subgroup 2 contains 24% of the training data and includes participants with baseline HbA1C less than 6·8% and baseline SF-36 general health score 48 or higher. Absolute risk reduction refers to the primary outcome of the Look AHEAD trial. For clarity, we removed from this figure two subgroups each containing 1% of the training data. SF-36 Short Form Health Survey. GH=general health. MCS=Mental Component Summary. ARR=absolute risk reduction (calculated using the testing data).

