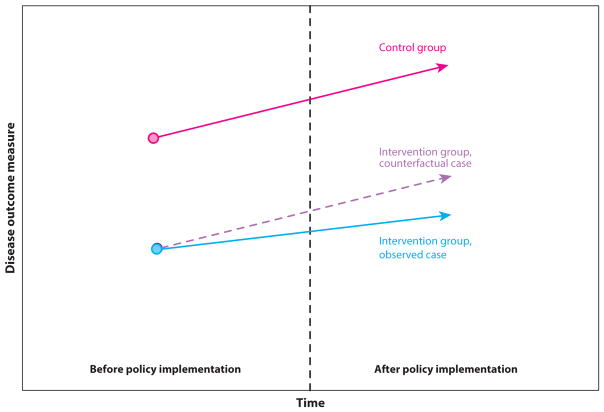
Figure 2.
Illustration of difference-in-differences analysis. Two groups are followed over time, where the difference between the groups before the intervention affects one group is assumed to be the likely difference that would have been observed afterward between the groups if the intervention had not occurred (hence, the intervention group would have the purple dashed line trajectory without the intervention). The difference between the dashed intervention group point after the policy and the observed intervention group result is estimated to be the policy effect.

