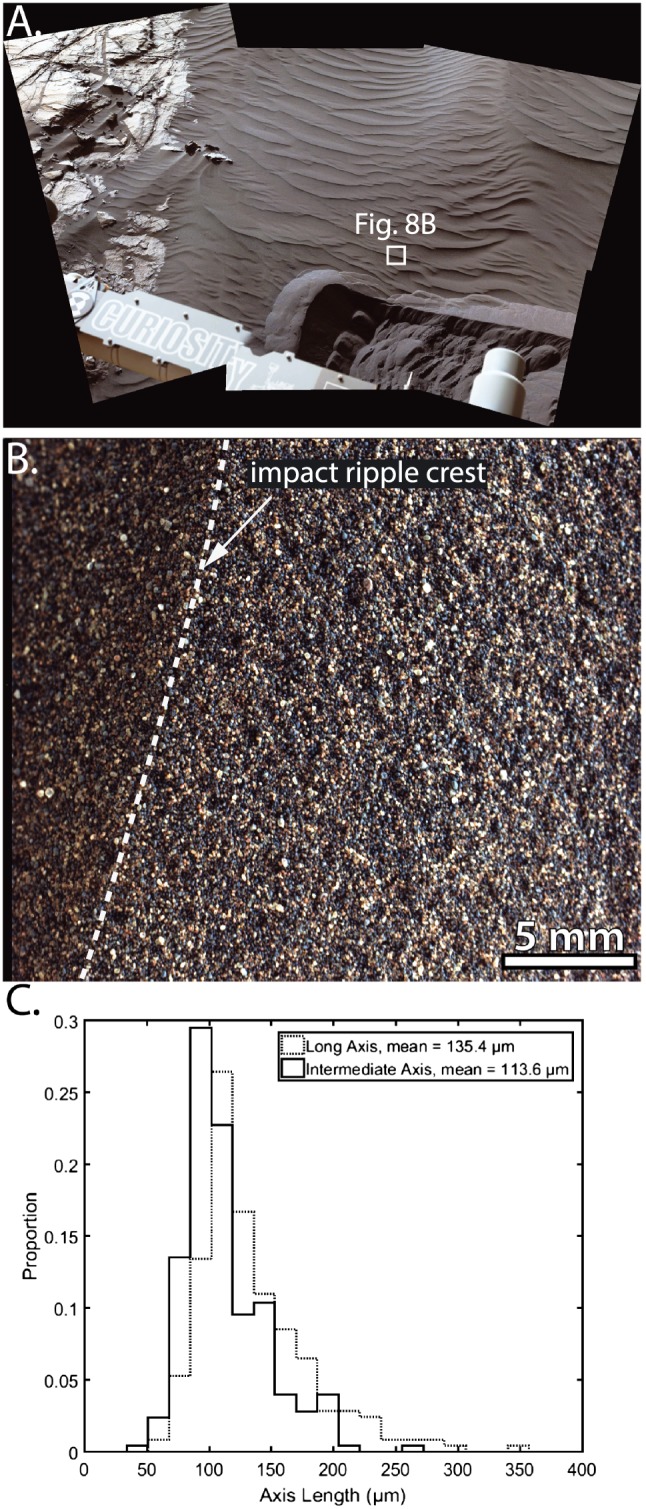
Figure 8.

Impact ripple grain size distribution. (a) Mastcam image of target Otavi (white box) and the adjacent wheel scuff near Gobabeb. (b) 1 cm standoff MAHLI image of the undisturbed ripple Otavi. The spatial resolution is ~16 ± 0.2 μm per pixel. (c) Distribution of maximum and intermediate axis grain diameters at Otavi measured grid‐by‐number style. Note that the inset shown in Figure 8b is rotated clockwise by 90° from its position shown in Figure 8a. Images: mcam05599 (Figure 8a) and MAHLI image 1242MH0005620010403684C00 (Figure 8b).
