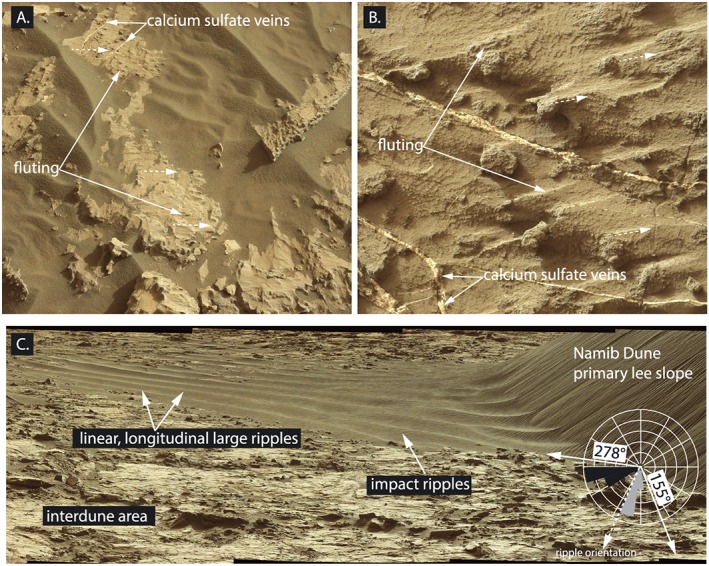
Figure 14.

Mastcam images showing interdune area between High Dune and Namib Dune. (a) Wind sculpted bedrock making up sediment availability‐limited interdune surface. (b) Wind abraded bedrock showing flute structures. (c) Linear large ripples formed at the intersection of the primary and secondary lee slopes of Namib Dune. Note the small ripples migrating orthogonal to the orientation of the linear ripple. The rose diagram shows the dip directions of the primary lee slope (gray) and secondary lee slope (black). The solid white arrows indicate the along‐slope sand transport direction from each slope where 278° corresponds to the direction of transport on the primary lee slope and 155° corresponds to the direction of transport on the secondary lee slope. The dashed white arrow indicates the orientation of the large ripples, which bisects the along slope transport directions. Images: mcam05330, Sol 1176 (Figure 14a); mcam05501, Sol 1200 (Figure 14b); and mcam05520, Sol 1214 (Figure 14c).
