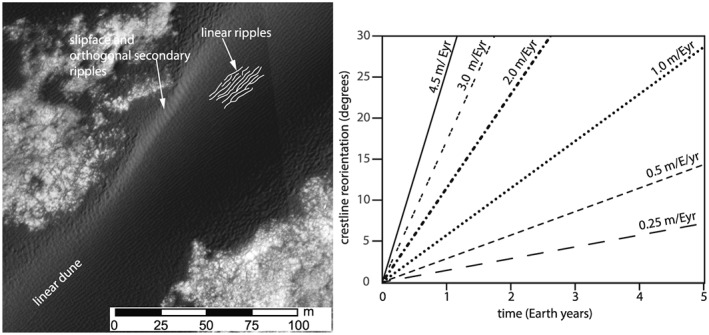
Figure 15.

HiRISE image of the linear dune area of the Bagnold Dune Field and a plot of ripple reorientation rates. (a) HiRISE image showing linear longitudinal ripples analyzed by Silvestro et al. [2016]. Note the secondary ripples migrating along a slip face of the linear dune are orthogonal to the orientation of the ripples at the crest. (b) The degree of ripple reorientation for different ripple migration rates. The timescales are based on Werner and Kocurek [1997] model of bed form reorientation through defect migration. Plot of the time to reorient a 10 m long ripple by varying degrees for different ripple migration rates. Images: HiRISE image: ESP_018854_1755_RED.
