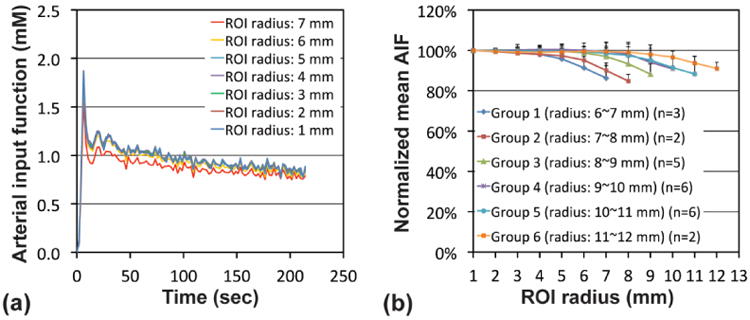
Figure 4.

Arterial input function (AIF) according to the ROI size. (a) AIFs at seven ROIs (original ROI plus six sub-ROIs) of a representative aortic image. (b) The normalized mean AIFs of six groups; the amplitudes of AIFs were normalized to that in the core ROI (1 mm radius) and then averaged over imaging time. Abdominal aorta was categorized into six groups according to its radius (groups 1-6).
