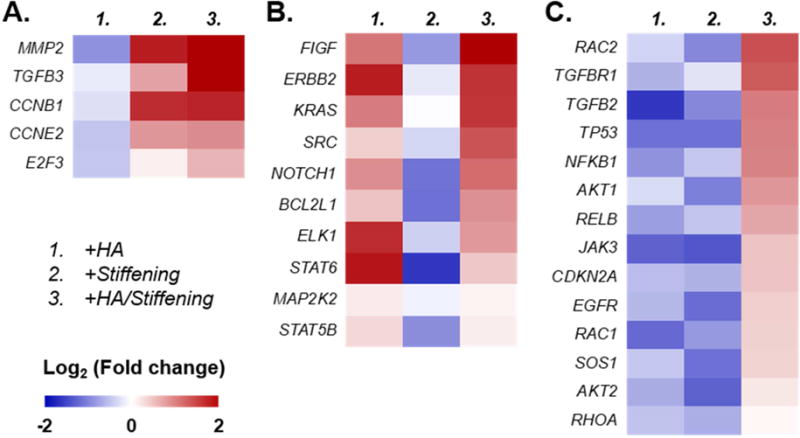
Figure 8. Identification of genes that were upregulated in COLO-357 cells encapsulated in specific gel formulations.

(A) Stiffening gel regardless of HA presence, (B) HA-containing gel regardless of gel stiffening, and (C) HA-containing and stiffened gel. Gene expression levels (plotted in Log2 scale) were normalized to GAPDH within each group, then normalized to respective gene in Gel/PEG hydrogels. Each of the four gel formulations contained three biological replicates. Warm (red) colors showed high expression, whereas cold (blue) colors showed low expression.
