
Figure 1.
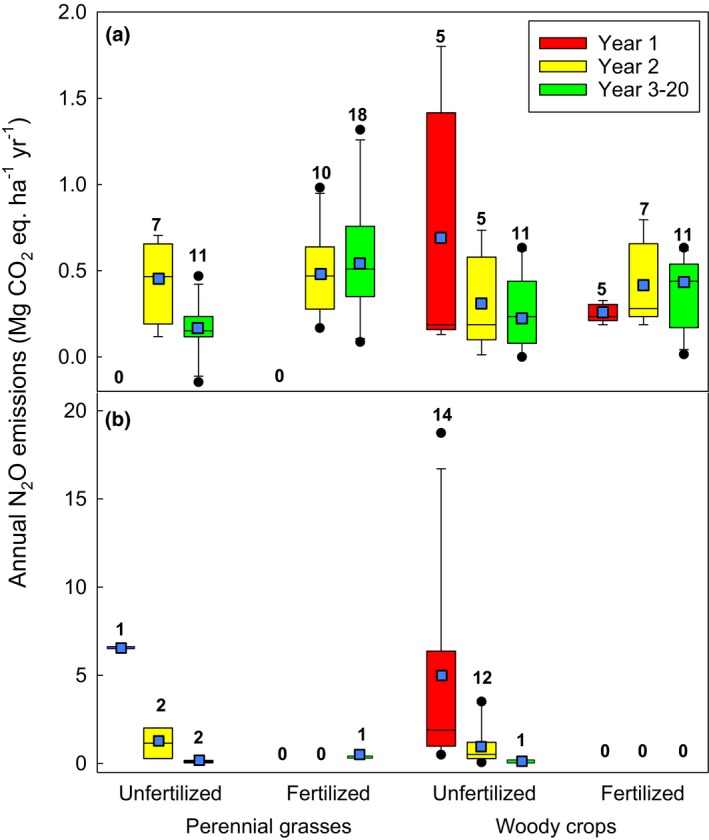
Effects of prior land‐use (a) annual crops and (b) grassland on annual N2O emissions of perennial grasses (Miscanthus, switchgrass) and woody crops (SRC willow and SRC poplar) grown with and without fertilizer. Box plot: the bottom and top of the box are the first and third quartiles, and the line within the box is the second quartile (median),  = average, whiskers indicate the 10th and 90th percentiles, dots indicate outliers. The values show the number of data sets. Note the y‐axis scales of (a) and (b) differ by an order of magnitude. Summary data are presented in Table S1.