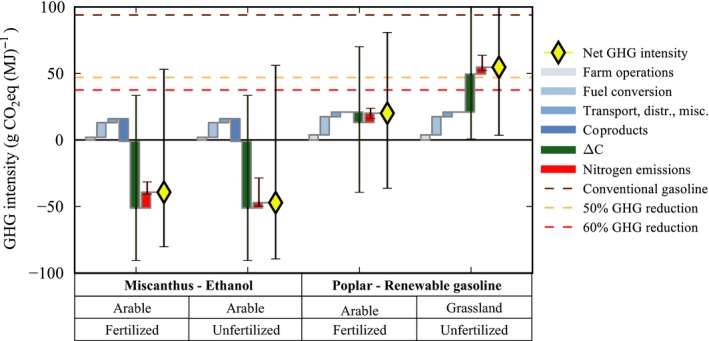
Figure 3.

A life‐cycle perspective of the relative contributions and variability of soil carbon stock change and nitrogen‐related emissions to the net GHG intensity (g CO 2‐eq MJ −1) of biofuel production via select production pathways (feedstock/prior land‐use/fertilizer/conversion type). Positive and negative contributions to life‐cycle GHG emissions are plotted sequentially and summed as the net GHG intensity for each biofuel scenario, relative to the GHG intensity of conventional gasoline (brown line) and the 50% and 60% GHG savings thresholds (US Renewable Fuel Standard and Council Directive 2015/1513); orange and red lines, respectively. Default life‐cycle GHG source estimates are taken from Wang et al. (2012) and Dunn et al. (2013); direct N2O emissions from Fig. 1; and soil carbon stock change (0–100 cm depth) from Qin et al. (2016). See Appendix S1 for detailed methods.
