
Figure 6.
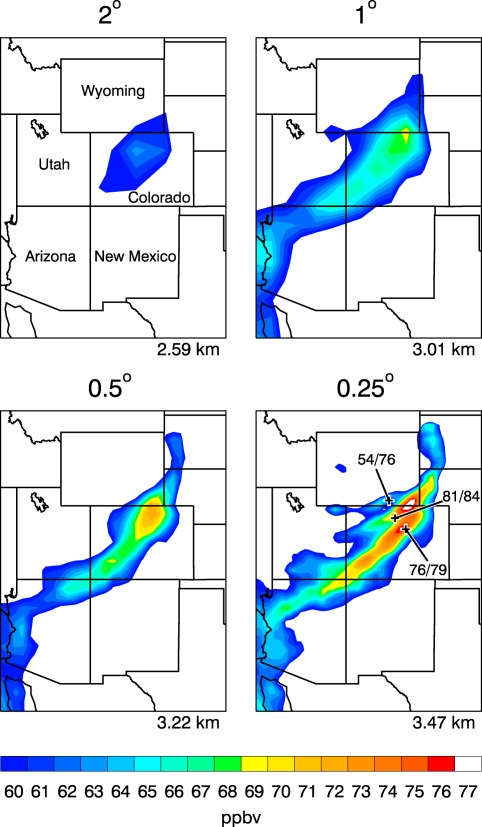
Surface O3 concentration at 6 PM MDT on Friday 6 April 2012 from four simulations of a stratospheric intrusion that are identical except for the labeled horizontal resolution. Observed current/peak‐event volume mixing ratios (ppbv) at the three locations mentioned in the text are drawn on the lower‐right plot. At bottom‐right of each plot, GEOS's highest elevation in Colorado is indicated. 880 m is gained when discretization is enhanced by a factor of eight.