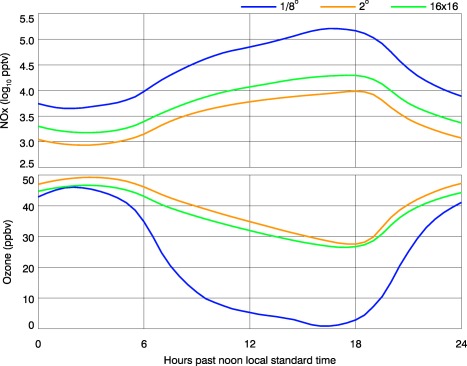
Figure 7.

Mean diurnal cycles of (top) NOx and (bottom) O3 surface concentrations from the 15 highest‐NOx locations during each of eight May days of companion 1/8° and 2° simulations. The three sample sets are: (1) high NOx cells from the 1/8° simulation (blue). (2) The collocated cells from the 2° simulation (orange). (3) The average of the concentrations in the 16 × 16 matrix of 1/8° cells with the same footprint as each respective 2° cell (green). Note that the NOx ordinate is scaled logarithmically and O3 is scaled linearly. The sample size is 120.
