Figure 8.

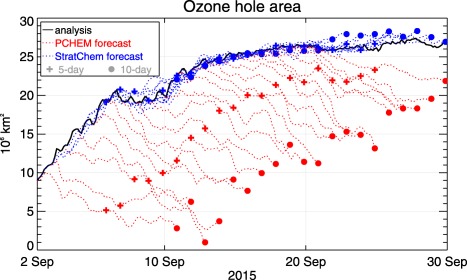
Area of the 2015 Antarctic O3 hole in the DAS (solid black) and during 10 day forecasts with PCHEM (dashed red) and StratChem (dashed blue). Crosses and circles show the areas in each forecast at 5 and 10 days, respectively.

Area of the 2015 Antarctic O3 hole in the DAS (solid black) and during 10 day forecasts with PCHEM (dashed red) and StratChem (dashed blue). Crosses and circles show the areas in each forecast at 5 and 10 days, respectively.