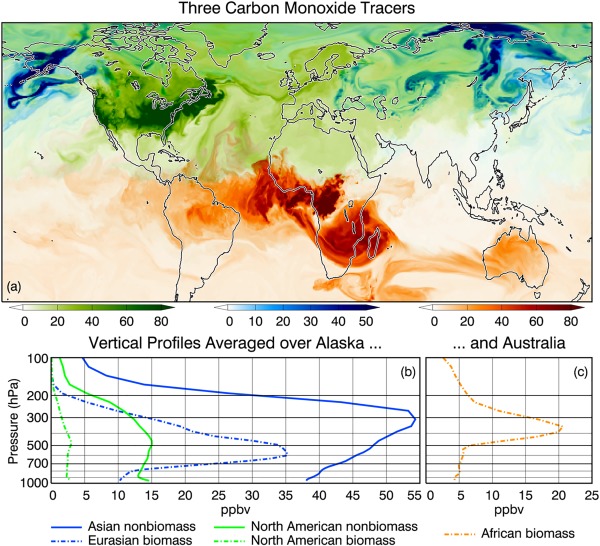
Figure 9.

(top) Distribution of three tagged tracers from the GEOS DAS forward processing system. Green: CO from North American nonbiomass burning emissions plotted at the surface. Blue: CO from Eurasian biomass burning plotted at 500 hPa. Orange: CO from African biomass burning plotted at 375 hPa. Darkest shades indicate highest concentrations. (bottom) Vertical profiles of CO tagged tracers averaged over (b) Alaska and (c) Australia.
