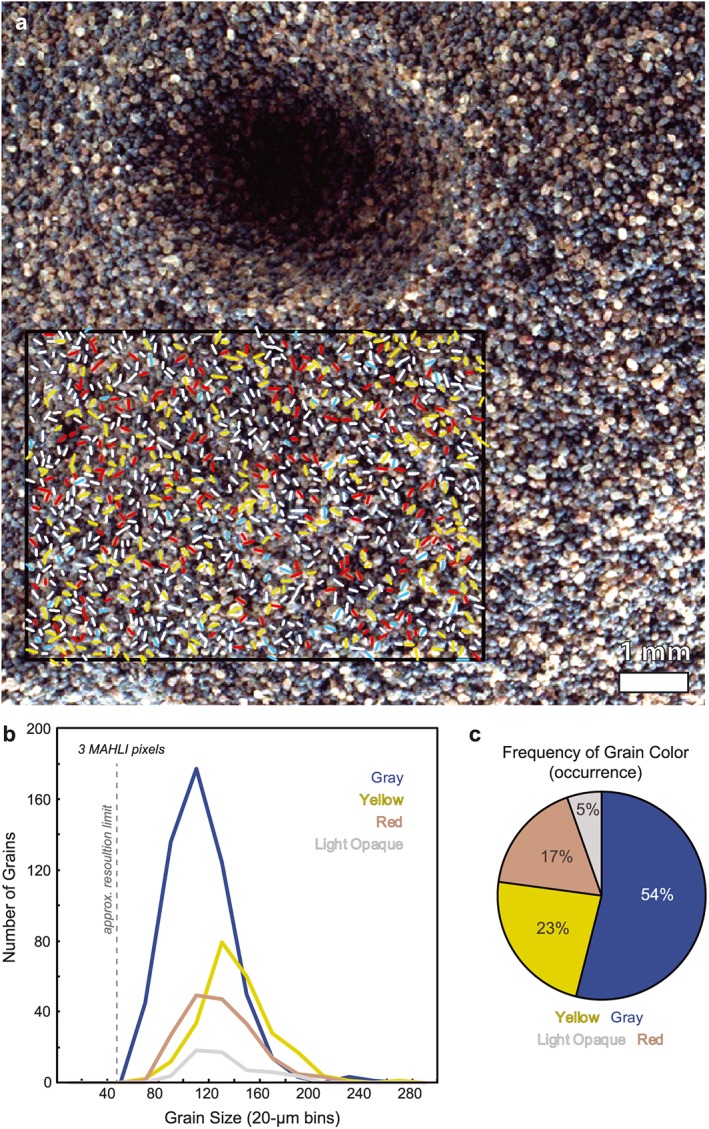
Figure 5.

(a) A portion of a MAHLI focus merge product showing sieved sands from Gobabeb scoop sample 1, discard pile A (1242MH0005740000403723R00; 15.7 μm/pixel), showing the ~30 mm2 area over which we made grain color occurrence estimates. The depression (top, left of center) is from a series of ChemCam LIBS shots into the discard pile, leaving behind a pit from laser interaction and plasma production. (b) The number of grains and size distribution by color of all 1023 grains catalogued; the distribution is well above the MAHLI threshold resolution for resolving grains. (c) A summary of the relative frequency of each color grain.
