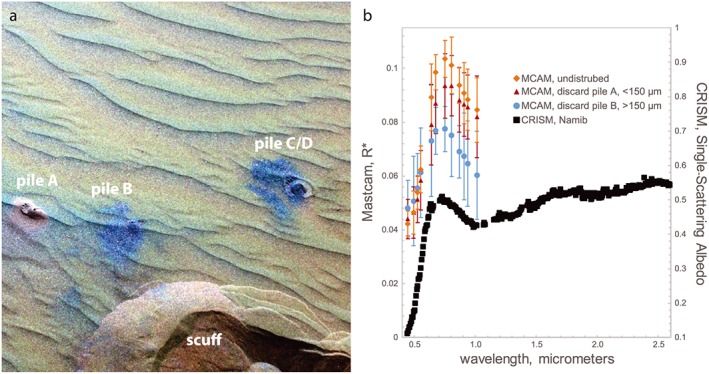
Figure 6.

(a) Mastcam false color image (from mcam5707 on sol 1234 with narrowband filters L6: 1012 nm; L4 676 nm; and L2: 445 nm as red, green, and blue, respectively) of sands at Gobabeb, Namib dune, which shows subtle visible/near‐infrared color differences in a portion of the scuff and the discard piles for samples A (<150 μm), B (>150 μm), C (150 μm to 1 mm), and D (>1 mm) (see text). (b) Mastcam spectra from locations corresponding to Figure 6a in units of R‐star, a proxy for reflectance [Johnson et al., 2017], along with processed CRISM single‐scattering albedo spectra from the Namib dune from CRISM image ATO0002EC79 [Lapotre et al., 2017]. The spectral shape is similar to CRISM data.
