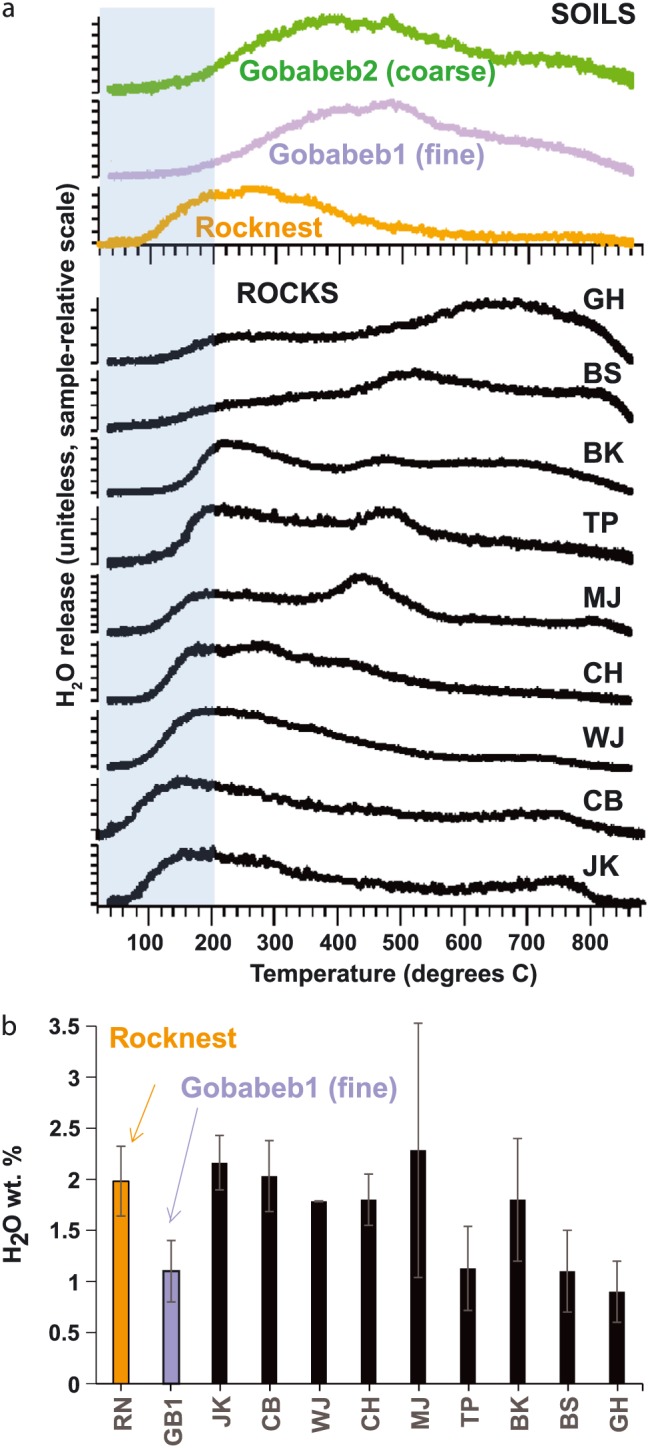
Figure 11.

SAM evolved gas analyses showing (a) the relative fraction of H2O released as a function of temperature for the Gale crater sands and soils discussed in this work as well as rocks drilled, powdered, and measured to date and (b) the calculated weight percent H2O for Gale crater soil and rock samples. The shaded region denotes release at <200°C, consistent with adsorbed or loosely bound water. All data in this figure are detailed in Sutter et al. [2017].
