Figure 13.

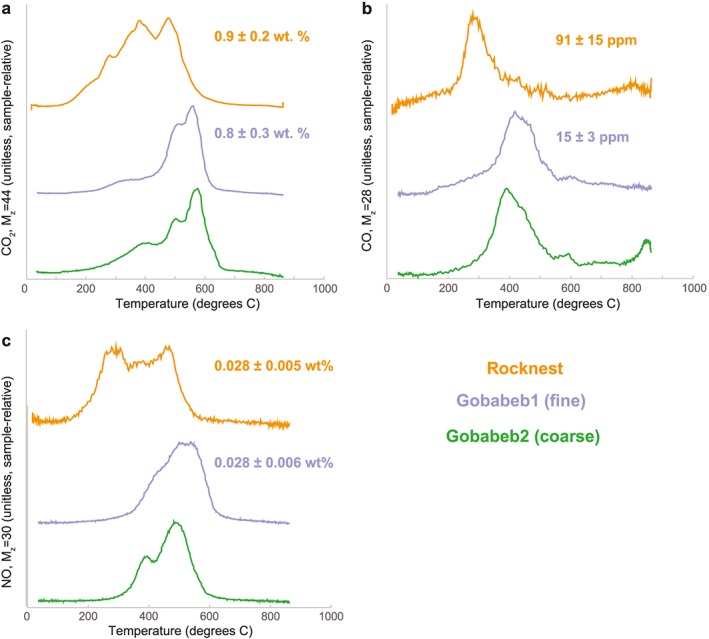
SAM evolved gas analyses of (a) CO2 (corrected for MTBSTFA), (b) CO, and (c) NO, showing release as a function of temperature for sand samples. Data are detailed in Sutter et al. [2017].

SAM evolved gas analyses of (a) CO2 (corrected for MTBSTFA), (b) CO, and (c) NO, showing release as a function of temperature for sand samples. Data are detailed in Sutter et al. [2017].