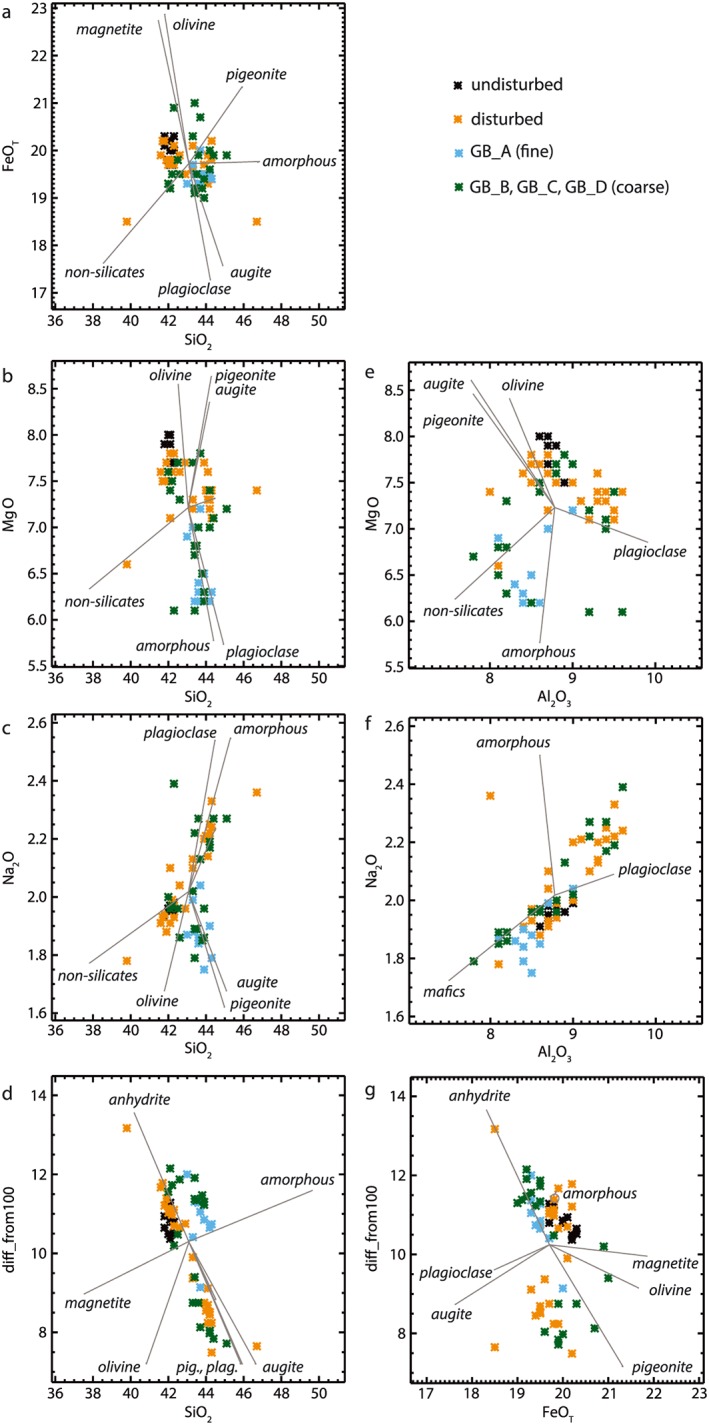
Figure 16.

Scatterplots illustrating relationships between elements as measured at the Namib dune by the ChemCam LIBS instrument. The centroid is the average ChemCam‐determined elemental composition, and lines radiate outward in the direction of end‐member crystalline phases or the amorphous phase as determined by CheMin [Achilles et al., 2017]. (a) FeO versus SiO2, (b) MgO versus SiO2, (c) Na2O versus SiO2, (d) element total difference from 100 wt % versus SiO2, (e) MgO versus Al2O3, (f) Na2O versus Al2O3, and (g) element total difference from 100 wt % versus FeO.
