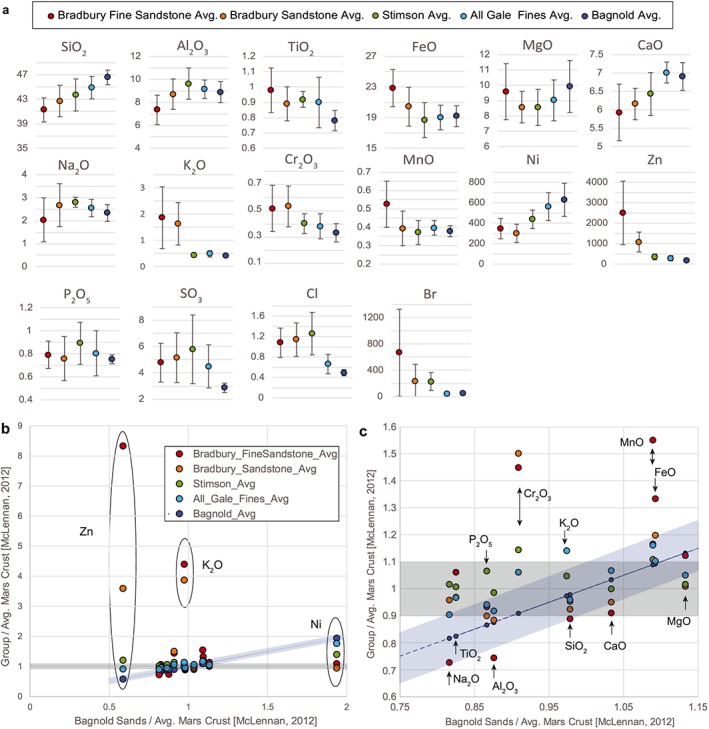
Figure 19.

Bagnold dune composition at active Namib, measured by APXS, and compared to other groups of materials with sand‐sized grains (Table 5): fine sandstones and sandstones of the Bradbury Group (Aeolis Palus), sandstones of the Stimson formation, and all Gale crater fine‐grained materials (including the Bagnold sands). Sandstone rock data are from Siebach et al. [2017]. (a) Each point is the group average for the oxide or element, and error bars indicate standard deviation of data. The y axis is in weight percent except for Ni, Zn, and Br, which are in ppm. (b) The groups from Figure 19a were then ratioed to the estimated Mars crust composition from McLennan [2012] to normalize data for plotting. The ratio for each group was then plotted versus the ratio for the Namib, Bagnold sands. Gray shaded areas indicate oxides or elements where measured compositions are ±10% of the estimated Martian crust. Blue shaded areas along the diagonal line indicate compositions within ±10% of the composition of Namib, Bagnold sands. Computed, volatile‐free compositions are used in Figures 19b and 19c.
