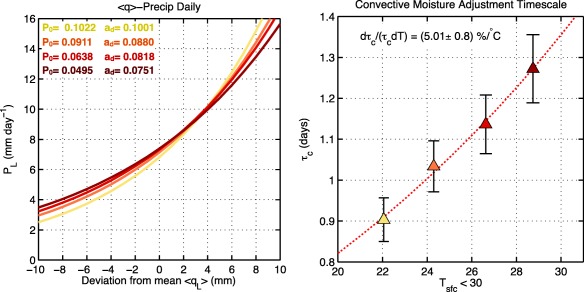
Figure 2.

(left) Nonlinear least squares fit of the relationship between and PL, as described by equation (4). The values of have been shifted such that the zeroth value corresponds to the value of that corresponds to the warm‐pool averaged value of PL. (right) Scatterplot of warm‐pool averaged (60°E–180°E, 15°N/S) convective moisture adjustment time scale τc, obtained from equation 6 for each simulation. Darker shadings of red depict higher concentrations of CO2, ranging from 0.5, 1, 2, 4 times preindustrial levels. The nonlinear least squares fit is shown as a dashed line.
