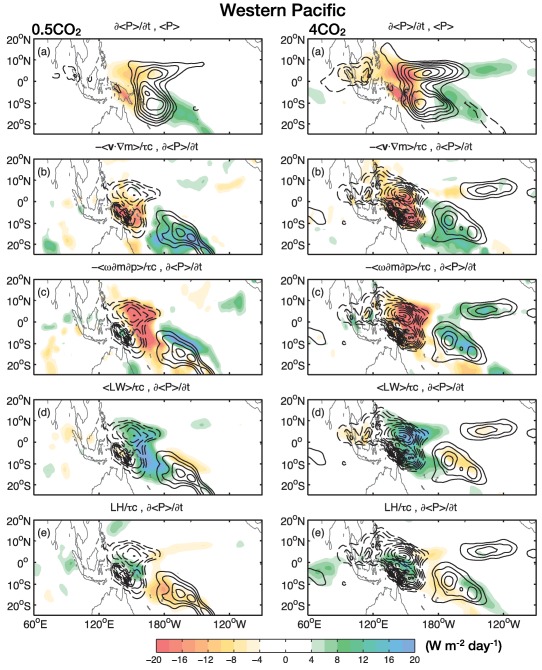
Figure 3.

Precipitation maintenance and propagation of an MJO regressed over the western Pacific sector for the (left) 0.5CO2 simulation and (right) 4CO2 simulation. (a) Estimated precipitation ( ) anomalies (contours) and its temporal tendency (shaded). Plots (b)–(e) show the column precipitation tendency and its contribution by (b) horizontal MSE advection, (c) vertical MSE advection, (d) longwave radiative heating, and (e) surface latent heat fluxes. Shading is in units of W m−2 d−1. Contour interval is every 15 W m−2 starting at 30 W m−2 for plot (a) and every 2 W m−2 d−1 starting at 4 W m−2 d−1 for plots (b)–(e).
