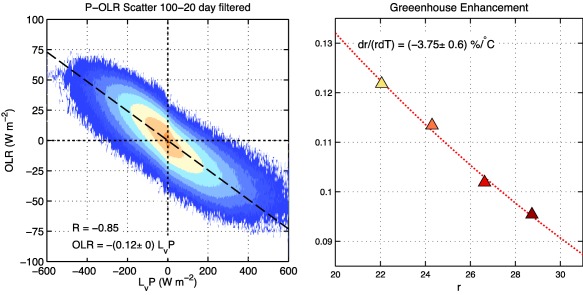
Figure 6.

(left) Scatterplot of 20–100 day filtered precipitation (in W m−2) against OLR anomalies. The shaded field in the scatterplot corresponds to the base‐10 logarithm of the amount of points located within 2 W m−2 × 2 W m−2 bins. The linear least squares fit regression is depicted as a dashed line, where the slope corresponds to the greenhouse enhancement factor r. The best fit regression equation and the correlation coefficient are shown in the bottom‐left corner. (right) Greenhouse enhancement factor r as a function of tropical surface temperature, for all four simulations. The nonlinear least squares fit is shown as a red dotted line and the rate of change per degree of warming is shown in the top‐left corner.
