Figure 7.

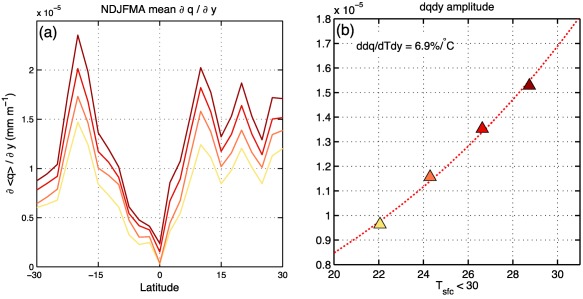
(a) Warm‐pool average (60°E–180°E) of the NDFJMA mean meridional gradient of column moisture for each of the four GISS simulations. Simulations with higher CO2 concentrations are shown as a darker shade of red. (b) Scatterplot of the root‐mean‐square value of of the NDFJMA mean over the Indo‐Pacific warm pool. The nonlinear least squares fit is shown as a red dotted line and the rate of change per degree of warming is shown in the top‐left corner.
