
Figure 8.
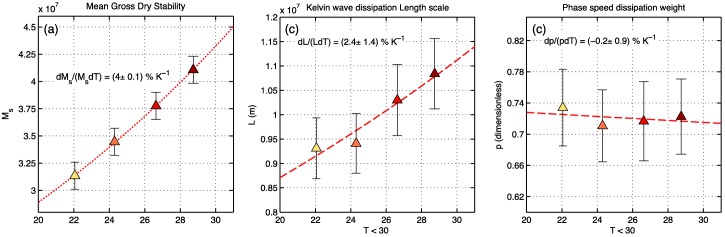
Scatterplot of warm‐pool averaged (a) gross dry stability , (b) Kelvin wave dissipation lengthscale L, and (c) the free‐tropospheric dissipation weight (see equation (11a)). The nonlinear least squares fit is shown as a red dotted line and the rate of change per degree of warming is shown in each plot.