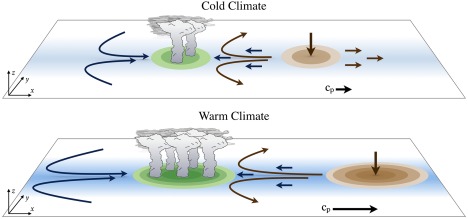
Figure 11.

Schematic summarizing the results found in this study. Blue shading along the horizontal plate represents mean column moisture, with darker shading indicating higher concentrations. Green and brown patches correspond to enhanced or suppressed moisture, respectively, with darker shading representing larger anomalies. The clouds correspond to anomalous precipitation. The wind anomalies corresponding to the region of enhanced and suppressed convection are shown in dark blue and dark brown, respectively. The curved horizontal arrows correspond to the Rossby wave response to equatorial heating and the straight horizontal arrows correspond to the Kelvin wave. As the climate warms the MJO‐related moisture anomalies become stronger and the zonal scale of the MJO increases. The horizontal moisture gradients increase, the convective adjustment time scale increases, while the amplitude of the wind anomalies changes little. The sum of the contribution from these changes leads to enhanced eastward propagation.
