Figure A1.

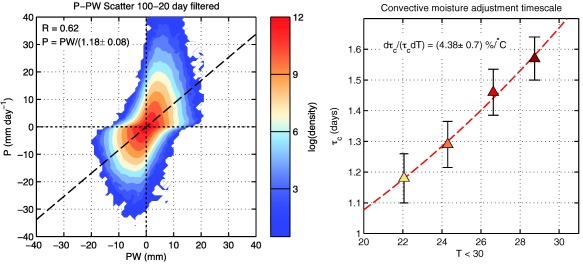
As in Figure 6 but showing precipitation and column moisture in the left plot and the convective moisture adjustment time scale estimated through linear regression , as in Jiang et al. (2016).

As in Figure 6 but showing precipitation and column moisture in the left plot and the convective moisture adjustment time scale estimated through linear regression , as in Jiang et al. (2016).