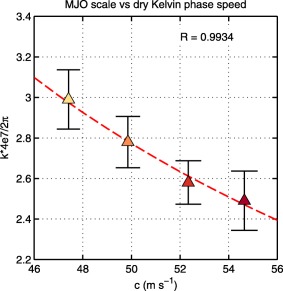
Figure C1.

Scatterplot of the phase speed of free Kelvin waves c, calculated using equation (13) versus the zonal wave number of the MJO estimated in Adames et al. (2017). The correlation coefficient is shown in the top‐right corner. Error bars correspond to the uncertainty in the estimate of the MJO's scale.
