Figure 1.

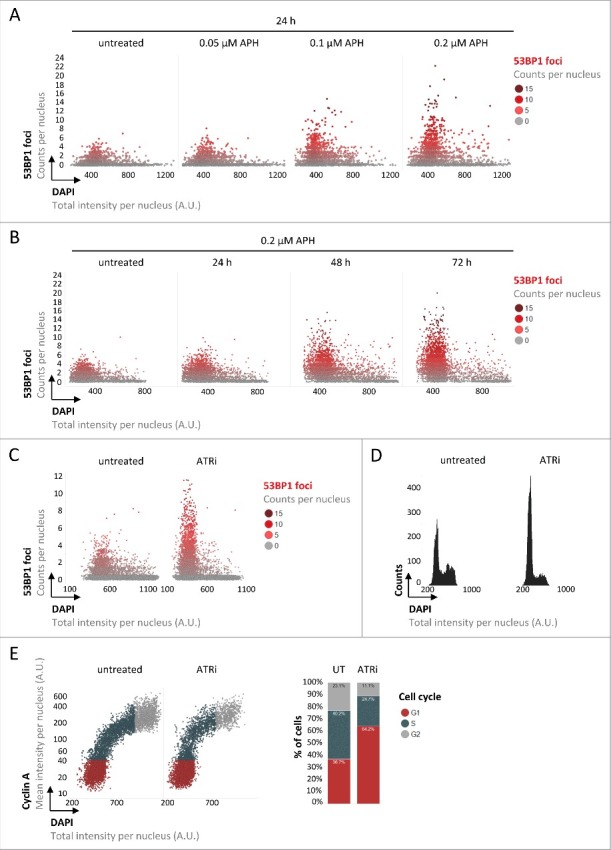
Replication stress-induced inherited DNA lesions result in an accumulation of cells in G1. (A) Asynchronously growing U-2 OS cells were treated with increasing doses of APH as indicated and stained for DNA content (DAPI) and 53BP1. 53BP1 foci per nucleus were measured by QIBC and are depicted in single cell scatter plots as a function of the cell cycle, from low DAPI to high DAPI intensities. (B) U-2 OS cells were treated for increasing time periods with APH as indicated and 53BP1 foci per nucleus are shown. (C) U-2 OS cells were treated with ATRi for 24 h and 53BP1 foci per nucleus are depicted. (D) One-dimensional cell cycle profiles are depicted for untreated and ATRi-treated U-2 OS cells based on total DAPI intensities. (E) Two-dimensional cell cycle profiles are depicted for untreated and ATRi-treated U-2 OS cells based on Cyclin A / DAPI co-staining. Cell cycle staging was performed according to the indicated color code and percentages of cells in individual cell cycle phases are shown on the right.
