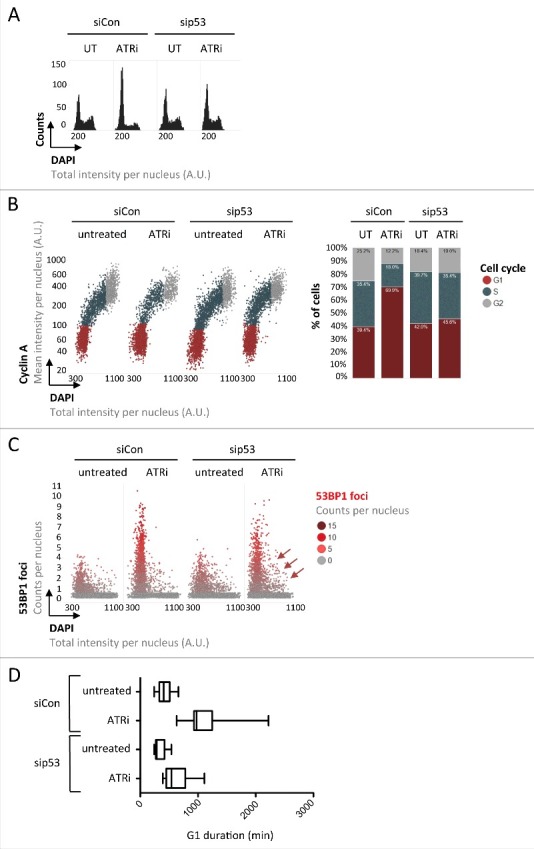
Figure 4.

The tumor suppressor protein p53 regulates G1 duration in response to inherited DNA lesions from the previous S-phase. (A) U-2 OS cells were transfected with siRNAs and exposed to ATRi as indicated. QIBC-derived one-dimensional cell cycle profiles based on total DAPI intensities are shown. (B) QIBC-derived two-dimensional cell cycle profiles based on Cyclin A / DAPI co-staining of U-2 OS cells are shown. Cell cycle staging was performed according to the indicated color code and percentages of cells in individual cell cycle phases are shown on the right. (C) 53BP1 foci were quantified in U-2 OS cells and are depicted as a function of the cell cycle. Note that loss of p53 leads to S-phase entry with elevated amounts of 53BP1 foci (red arrows). (D) Asynchronously growing FUCCI U-2 OS cells were transfected with siRNAs for 24 h and then exposed to ATRi as indicated. Cells were followed by time-lapse microscopy for 72 h at 30 minutes intervals and G1 duration was determined in individual cells.
