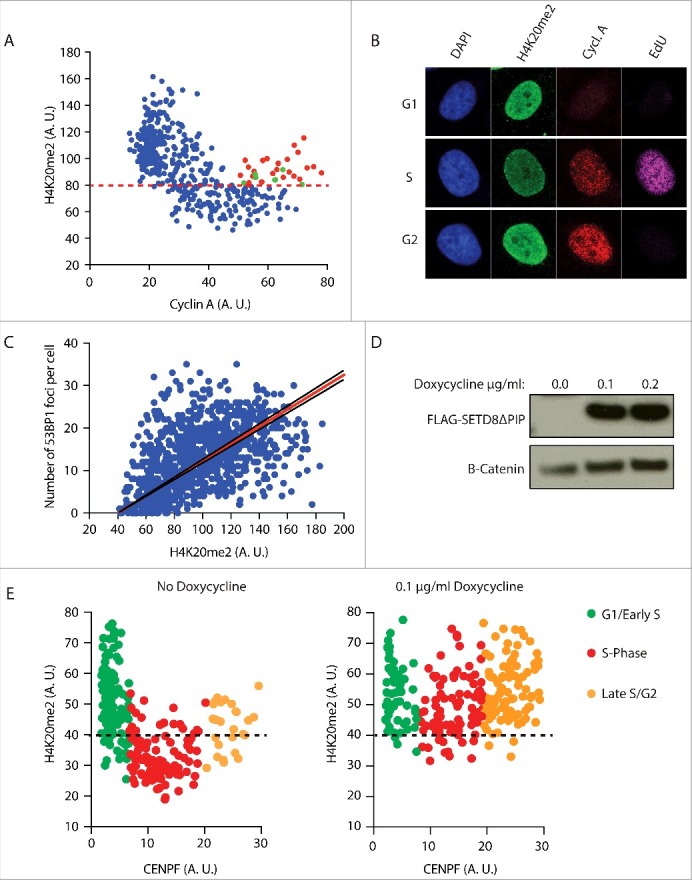
Figure 3.

The number of 53BP1 foci correlates with the level of H4K20me2. a) Fluctuation of H4K20me2 throughout the cell cycle. Asynchronous HeLa cells were pulsed for 45 min with 10 µM EdU and stained for Cyclin A, EdU and H4K20me2. Levels of H4K20me2 of each cell were plotted against the levels of cyclin A. Levels are represented as mean fluorescence intensity (arbitrary units). Red dots indicate late G2 cells (EdU negative and high Cyclin A) that show high levels of H4K20me2. Green dots indicate late G2 cells that haven't re-established H4K20me2 levels yet. Red dashed line mark differentiates high levels of H4K20me2 typical of G1/Early S-phase cells and low levels of H4K20me2 typical of S-phase cells. b) Representative images of experiment in a). c) 53BP1 foci formation is proportional to the levels of H4K20me2. Cells were irradiated with 5 Gy and stained for 53BP1 and H4K20me2 after 2 h recovery. The number of 53BP1 foci was plotted against the levels of H4K20me2 represented as mean fluorescence intensity (arbitrary units). Calculated correlation index is 0.49. d) Western blot analysis of flag-tagged SetD8ΔPIP overexpression in U2OS cells incubated with 0.1 µg/ml and 0.2 µg/ml of doxycycline for 16 h. Anti-flag antibody was used to detect flag-tagged SetD8ΔPIP. e) In parallel, cells were stained for H4K20me2 and CENPF, which mirrors cyclin A expression from G1 to G2 phase of the cell cycle. Cells not treated with doxycycline show fluctuation of H4K20me2 (left). Induction of SETD8ΔPIP overexpression with 0.1 µg/ml doxycycline for 16 h increases H4K20me2 levels in S-phase (right). G1/Early S, S-phase and Late S/G2 cells are characterized using 2 thresholds of CENPF levels. Black dashed line differentiates high levels of H4K20me2 typical of G1/Early S-phase cells and low levels of H4K20me2 typical of S-phase cells. Levels are represented as mean fluorescence intensity (arbitrary units).
