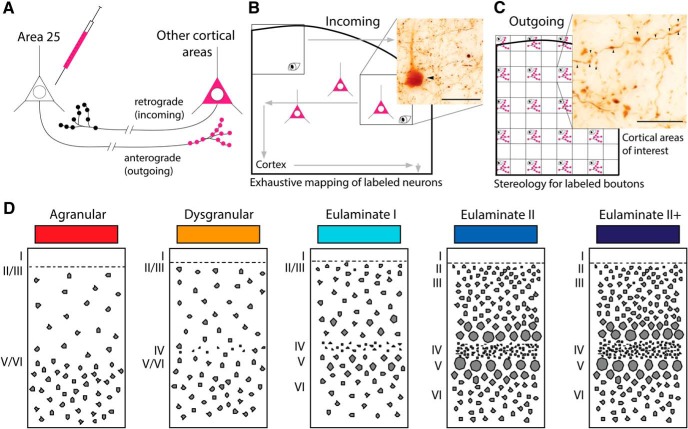
Figure 1.
Experimental design. A, Bidirectional tracer transport to study connections. B, Exhaustive mapping of tracer-labeled neurons in sections of cortex, a small portion of which is depicted by the thick black outline. Arrowhead indicates a BDA neuron visualized with DAB. Scale bar, 250 μm. C, Strategy for unbiased, systematic stereologic sampling in cortical areas of interest (thick black outline) to quantify density of tracer-labeled terminations (axon boutons) from A25. Terminations in blank squares are not counted. Arrowheads indicate BDA boutons visualized with DAB. Scale bar, 75 μm. D, Schematic depicts five different cortical types based on architectural differences. Agranular areas are three layered cortices with poorly defined lamination, whereas eulaminate II+ depicts areas with the highest level of laminar definition within areas with label in this study.

