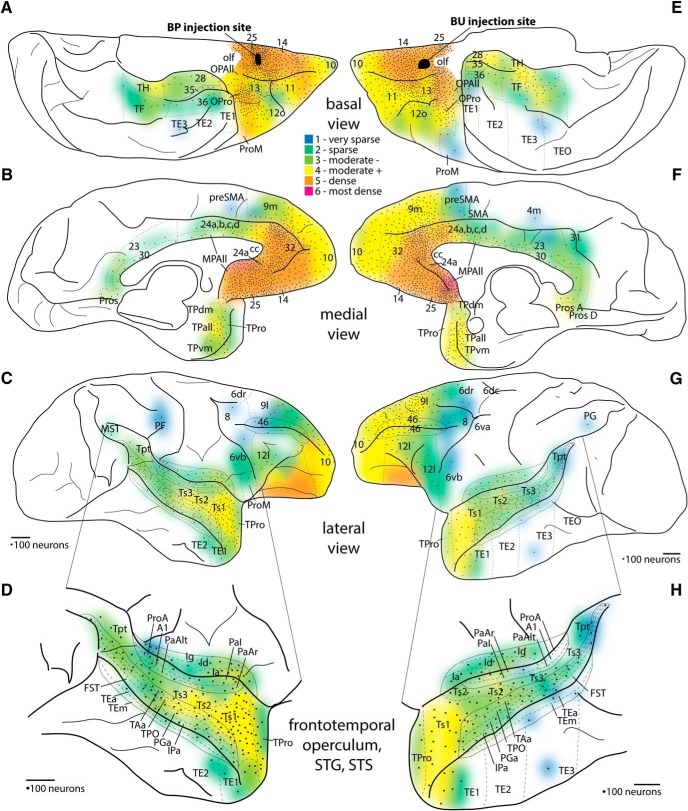
Figure 6.
Density maps of projection neuron populations directed to orbital A25. A–C, Density of cortical connections to A25. Black represents injection site, Case BP. A, Basal surface. B, Medial surface. C, Lateral surface. D, Enlargement of lateral temporal cortex and surrounding areas. E–G, Density of cortical connections to orbital A25. Black represents injection site, Case BU. E, Basal surface. F, Medial surface. G, Lateral surface. H, Enlargement of lateral temporal cortex and surrounding areas. Colors represent the binned normalized density of neurons projecting to A25 from each cortical area, from least dense (1 indicates dark blue) to the most dense (6 indicates red). Dotted lines indicate areal parcellation. Black dots represent every 100 labeled neurons counted from coronal sections depicted as a topographic histogram of projection neurons directed to A25. For each area on a section, one dot was placed for the first bin of 1–100 neurons, and another dot for the next bin of 101–200, and so forth. Dots were placed only once if the area was represented on multiple surfaces, but colors were placed on every surface on which a cortical area appeared (e.g., ventrolateral 10 contains colors in A and C, but dots were placed only in A). Scale bars, 2 mm.

