Figure 9.
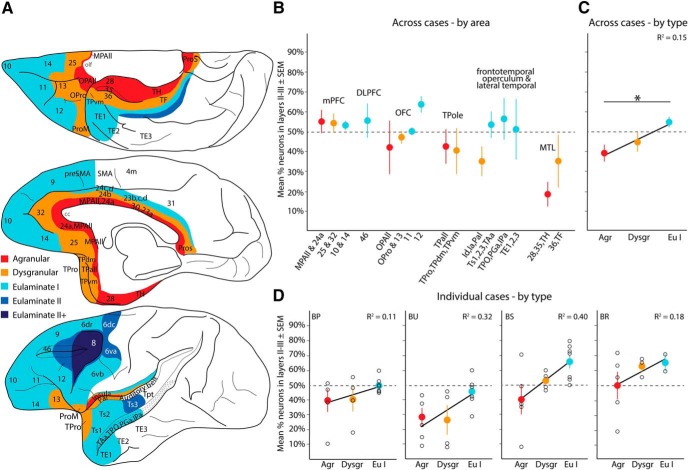
Laminar patterns of A25 pathways vary by cortical type: projection neurons. A, Map of cortical areas projecting to A25 are color-coded by cortical type: agranular (red) to eulaminate II+ (darkest blue). Areas outside the PFC with no A25 connections were left blank. B, Average percentage neurons (±SEM) across cases originating in superficial layers II–III, organized by system and then by laminar structure (indicated by colors that represent cortical types) within each system. Data from some similar architectonic areas within systems were combined (e.g., areas MPAll and 24a). C, Cortical areas in B were pooled across cases and regressed by cortical type. This analysis showed that the proportion of labeled neurons in the superficial layers increased as cortical structure (type) was more elaborate. Average percentage (±SEM) shown (colors) with linear fit from the regression and corresponding adjusted R2. D, Individual cases with average percentage of labeled neurons in superficial layers (±SEM) and linear fit from regression show a consistent upward trend. Black circles represent individual cortical areas and convey variability. olf, Olfactory cortex and nuclei. *significant difference.

