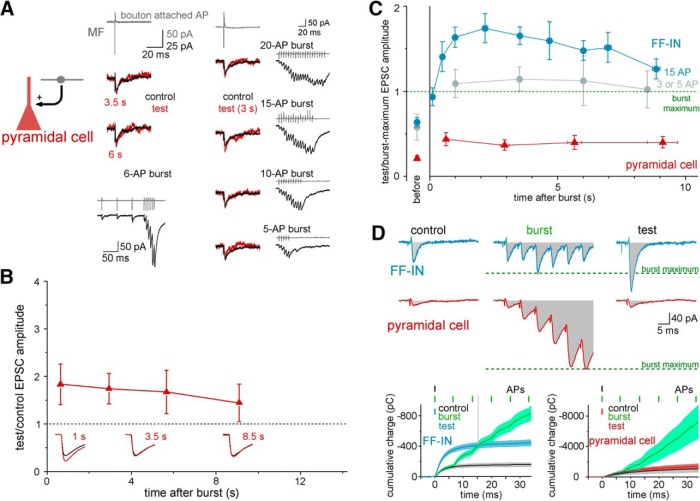
Figure 2.
Postsynaptic cell type specificity of postburst potentiation of MF-EPSCs. A, Single presynaptic MF bursts, consisting of various numbers of APs, resulted in small postburst potentiation effects on the EPSCs of a representative MF-pyramidal cell pair. Traces represent presynaptic MF terminal APs in bouton-attached recordings (gray) and the postsynaptic responses before and after single burst. Bursts and postsynaptic responses (including preburst control and postburst test EPSCs, and during-burst responses) are shown next to the corresponding traces. B, Time course of the effects of single, brief presynaptic bursts (6 or 15 AP, 150 Hz) on subsequent single-AP-evoked MF-EPSCs in postsynaptic CA3 pyramidal cells (n = 46 data points from n = 12 pairs; compare with Fig. 1B). Inset, Example control and test MF responses at different postburst delays. Anatomy of the postsynaptic pyramidal cell and presynaptic DG GC (back-labeled via the MF terminal recording) is shown in Figure 2-1. C, Summary graph showing the amplitude of the postburst test responses in pyramidal cells and FF-INs relative to the compound maximal amplitudes reached during the bursts (dashed line) in the same synaptic inputs (red represents pyramidal cells, n = 46 data points from n = 12 pairs; blue represents FF-INs with 15 AP bursts; light blue represents FF-INs with short, 3 or 5 AP bursts, n = 10 pairs; the same responses were reanalyzed as in Fig. 1B,C). The relative amplitudes of the preburst control responses (“before”) are shown separately. D, Comparison of MF-EPSCs before, during, and after single presynaptic MF bursts in a representative FF-IN (blue traces) and pyramidal cell (red). Green dashed lines indicate maximum amplitude of the compound EPSCs during the burst for comparison. Gray areas represent the integral areas (charge transfer). Bottom, Graphs represent the activity- and postsynaptic cell type-dependent differences of the time course of charge transfer.

