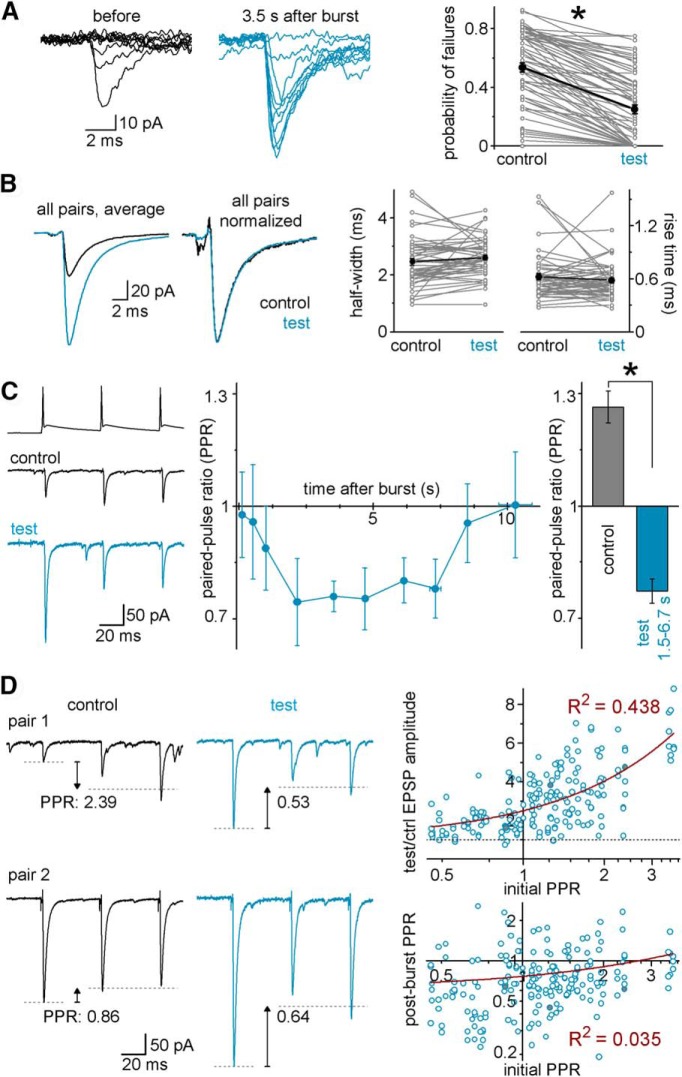
Figure 4.
Presynaptic origin of the burst-induced potentiation in FF-INs. A, The probability of synaptic response failures decreases after single presynaptic MF bursts. Representative traces of a CA3 GC-CCK+ basket cell connection before (black) and after (blue) single bursts (10 traces from each condition). Right, Connected gray symbols represent the failure rates in individual pairs with identified FF-INs (n = 68 pairs) during control and test MF stimuli (1.5–6.7 s postburst delays). Black represents the average data from all FF-IN connections. The failure rates were analyzed from at least 10 trials for each condition. B, Actual and normalized average EPSCs evoked in FF-INs (n = 51 pairs) by single MF APs before and 1.5–6.7 s after single presynaptic bursts. The events were aligned to the presynaptic AP peak. Graphs represent the half-width and 10%–90% rise times of the MF responses in individual FF-INs (gray) and their average (black), which were similar before and after the bursts. C, Example traces demonstrating changes in short-term plasticity of the MF-EPSCs in an IvyC evoked by 3 APs before and 6 s after bursts (control PPR: 1.26; test PPR: 0.45). Summary plot shows data from all in identified postsynaptic FF-INs; the PPR (calculated as the ratio of the average of the second and third amplitudes to the first amplitude) was low during the time when the EPSCs were potentiated. Summary bar graphs represent PPRs of all FF-IN connections before (control) and 1.5–6.7 s after the burst (test). D, Example traces: from IvyC MF pairs; note the similarity of test PPRs (at 6 s postburst) despite the different control PPRs. Right panels: Top, Correlation between the control (initial) PPR and the magnitude of potentiation (linear fit, maroon line; note the logarithmic scaling of the PPR axes). Bottom, Independence of postburst test PPR of the control PPR. Each circle represents individual test responses from identified FF-IN pairs. Circles with gray fillings indicate the representative pairs illustrated in C and D. * marks significant difference between control and test responses (see text for details).

