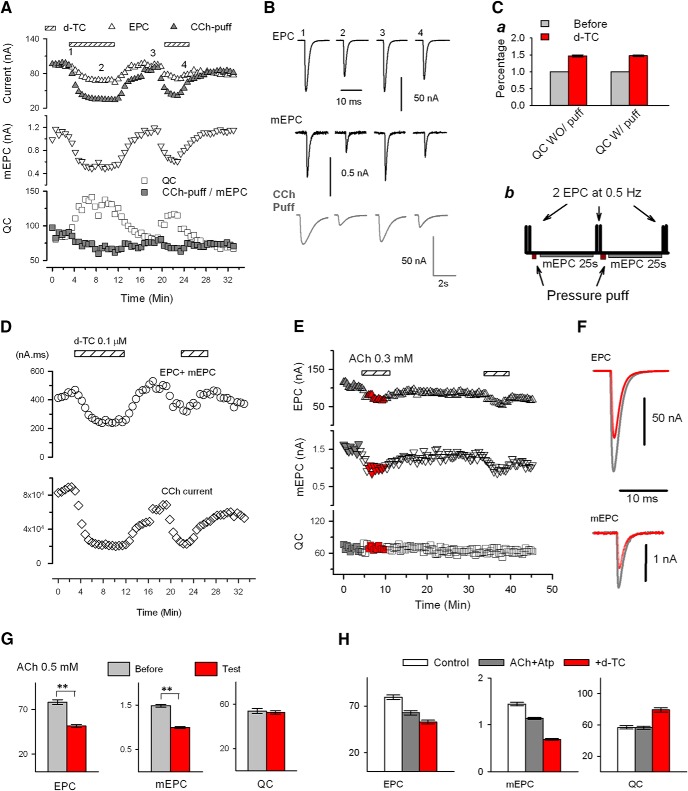
Figure 3.
Upregulation of QC is independent of synaptic function. A, Pulsatile application of the agonist CCh that produces large CCh-gated currents does not prevent the D-TC-induced increase in QC. EPC, puffed CCh-evoked current, and mEPC were acquired alternately by the protocol shown in Cb. Average EPC (up triangle, open, average mEPC (down triangle), and QC (square, open) were plotted against time. For comparison, the value of CCh-evoked current (up triangle, filled) was normalized to that of EPC recorded before D-TC infusion, and the ratio of CCh-evoked current/mEPC were also plotted (square, filled) along-side QC. The bathing solution was switched to a solution containing 0.1 μm D-TC as indicated by horizontal bars. B, Representative traces of EPC, CCh-evoked current, and mEPC were taken at times denoted by the numbers in A. Ca, Comparison of QC increases (percentage of control) by D-TC infusion with (n = 22, same data as in Fig. 2A control) /without (n = 11) puffing of CCh (t(9)=−15.213, p = 9.98E-8, paired t). Cb, Protocol used in A. It is a variation of protocol shown in Figure 1Bb. with addition of pressure puffing of agonist onto the NMJ being recorded after acquisition of EPC and recording of 25 s mEPC in each cycle. D, Total postsynaptic current for a given time period of the recording shown in A was measured by taking the integral of the various currents over each 25 s epoch. The top panel is a plot of the summed integrals of EPCs and mEPCs before and after D-TC infusion. The bottom panel is a plot of the current in response to intermittent application of carbachol. Despite the CCh induced currents being 200 times larger than the combined total EPC and mEPC currents in the same recording cycle, the D-TC-induced increase in QC is robust. E, Desensitization of nAChRs does not trigger an increase in QC. Plots of average EPC, mEPC, and QC obtained using the protocol shown in Figure 1Bb. Despite a 40% reduction in EPC and mEPC amplitudes (measured at the time indicated by the red symbols), there was no increase in QC. F, Averaged EPC and mEPC traces before (gray) and in the presence of ACh (red) taken from times corresponding to colored symbols on the plots shown in D. G, Mean data from 10 muscles treated with ACh: n = 43 NMJs before and 102 NMJs during ACh infusion (Table 1). H, Mean data from 8 muscles before (white, n = 38 NMJs) treated with ACh 0.1 mm and atropine 10 μm (gray, n = 43 NMJs) and with addition of 0.1 μm D-TC (red, n = 56 NMJs). Nested analysis showed significant reductions in EPC and mEPC amplitude after application of ACh and further significant reductions after addition of D-TC. **p < .01. QC was statistically increased after D-TC infusion, whereas application of ACh and atropine alone had no effect (Table 1).

