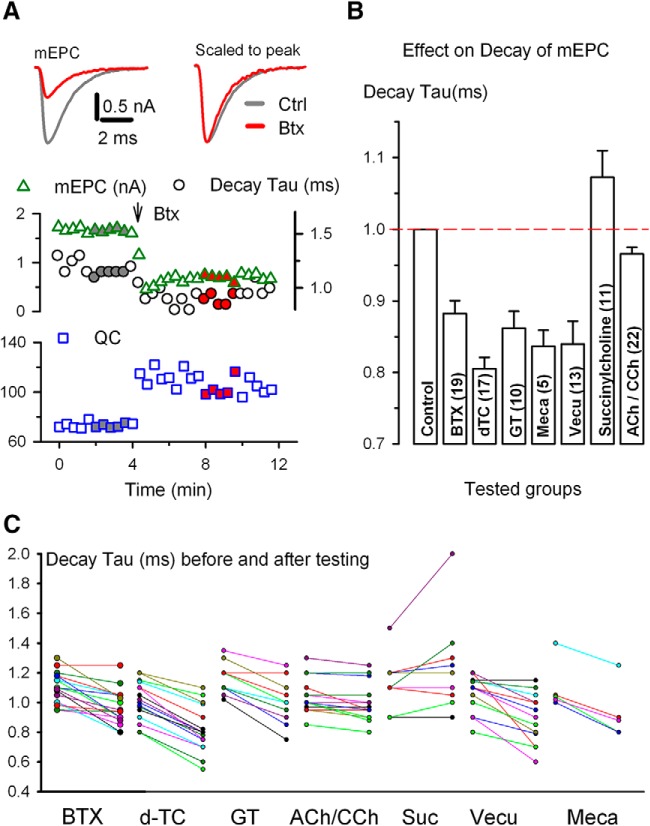
Figure 5.
Upregulation of QC correlates with an increase in decay rate of mEPC. A, Plots of averaged mEPC amplitude (triangle), decay tau* (circle), and QC (square) against time. Data were acquired using a protocol shown in Figure 1A. BTX (200 μg/ml) was pressure puffed onto the endplate at the time indicated by the arrow. Left top, Superimposed mEPC traces (left) and peak normalized traces (right) shown were averaged from the time points indicated by the gray and red filled symbols on the mEPC plot (middle). For reference, same colorations apply to symbols in QC plot (bottom). B, Decay constant of mEPCs in the presence of drug relative to that of control. The same endplate was used to obtain mEPC values in the presence and absence of drug and the number of endplates in each case is indicated in parentheses. Statistically significant decrease in normalized decay time constant was seen in all pairs (except for an increase in succinylcholine) (Table 1). Comparison of mEPC decay time constant reduction between the ACh/CCh group and the BTX group yielded significance (t(38) = 4.197, p = 1.57E-4, t test). GT, Gallamine. C, Scattered plots of mEPC decay tau before and in the presence of nAChR antagonists. Two measurements of each endplate are connected by a colored line. Data are from the same experiments shown in B (Table 1). *The rate of decay was measured as the time elapsed from the peak of the averaged mEPC to peak/e.

